Showing posts with label shiny. Show all posts

Wednesday, July 16, 2014

Pick a Color Site built in R with Shiny tags %$%

I started down the color path with yesterday’s post Palette of Colors from Image %>% ggplot2 %>% rCharts + dimple.js.  Although R has lots of tools, such as RColorBrewer and the mentioned rPlotter, javascript does too with Gregor Aisch's chroma.js and this translated-from-Perl color-scheme-js.

I figured I should explore these javscript color tools but not in the easy way.  Rather, I thought I should make it a little more challenging by forcing myself to build the site all in R using Shiny Tags based on an idea proposed by Ramnath Vaidyanathan in this rChartsDygraphs issue.  While I was at it, I thought I should keep plugging away with magrittr by playing with the new %$%.

I’m sure the result would amuse professional web developers and color pickers and probably even diehard R coders, but at least there was a result.

image

Thursday, May 2, 2013

Changing The Presidential Election with R in the Browser

After I finished with the tutorial post d3 <- R with rCharts and slidify and then saw R creates d3/javascript charts in Ipython Style Notebook, a light clicked.  I could finally answer the lingering question I have had ever since I saw the NYT 512 Path to the White House brilliantly created by Mike Bostock and Shan Carter with d3.

What would happen if different states had a different number of votes?

I never dreamed that I would be able to answer my own question by live R coding in the browser in an Ipython style notebook.  I felt like I needed a screencast to prove it.  Here is the short version.


Here is the extended version with director commentary (in type).


Thanks Ramnath Vaidyanathan, Yihui Xie, and Mike Bostock.

Wednesday, March 27, 2013

“Building ractives is so addictive it should be illegal!”

clickme is an amazing R package. I was not sure what to expect when I first saw Nacho Caballero's announcement. I actually was both skeptical and intimidated, but neither reaction was justified. The examples prove its power, and his wiki tutorials ease the noobie difficulties. Very similar to shiny, clickme serves as an integration point for html, javascript (especially d3), and R. While clickme does not allow the R websocket interactivity that shiny does, its more concentrated focus on quick reproducibility and sharing makes it a very useful tool. This is very much in the spirit of http://dexvis.wordpress.com/ Reusable Charts. ractives defined as

(short for interactives-a hat tip to Neal Stephenson), which are simple folder structures that contain a template file used to populate the JS code with R input data

provide the structure for clickme to produce an html file from

  1. a template in R markdown (template.rmd)
  2. a translator R script (translator.r)
  3. a data source
  4. external scripts (probably javascript) and styles (.css).

Inspired by the clickme longitudinal heatmap example, I just had to try to create my own ractive. I thought Mike Bostock's line chart example would serve as a nice template for my first ractive. The data not surprisingly will come from the R finance package PerformanceAnalytics dataset named managers. With very minor modifications to the Bostock source and a simple custom R script translator (translator.R shown below), we have everything we need for this ractive, which I will call multiline.

#' Translate the data object to the format expected by current template
#'
#' @param data input data object
#' @param opts options of current template
#' @return The opts variable with the opts$data variable filled in
translate <- function(data, opts = NULL) {
require(df2json)

# I would like to generalize this to handle both price and return right
# now just handles return clickme template.Rmd javascript can handle
# prices or cumulative so we will send cumulative which can serve as price

# remove na
data[is.na(data)] <- 0
# get cumulative growth
data <- cumprod(1 + data)


# convert to data frame
data.df <- data.frame(cbind(format(index(data), "%Y-%m-%d"), coredata(data)))
colnames(data.df)[1] = "date"
# melt the data frame so we have our data in long form
data.melt <- melt(data.df, id.vars = 1, stringsAsFactors = FALSE)
colnames(data.melt) <- c("date", "indexname", "price")
# remove periods from indexnames to prevent javascript confusion these .
# usually come from spaces in the colnames when melted
data.melt[, "indexname"] <- apply(matrix(data.melt[, "indexname"]), 2, gsub,
pattern = "[.]", replacement = "")
opts$data <- df2json(data.melt)
opts
}


Now to create our first clickme html page, we just need a couple lines of code in R.

# if not already installed, uncomment the tow lines below
# library(devtools) install_github('clickme', 'nachocab')

require(clickme)
# set location where you put your multiline ractive
set_root_path("your-path-goes-here/ractives")
require(PerformanceAnalytics)
data(managers) #although I use managers, really any xts series of returns will work
clickme(managers, "multiline")

Then, we have a web page that will create an interactive d3 line chart using the cumulative growth of the managers return series. If you do not see the embed below, then please follow the link.


Eventually, it will be very nice to have an entire gallery of amazing ractives.


git repo

Thursday, December 20, 2012

Shiny/R Conversion of Another One of My Favorite Mike Bostock d3 Examples

Mike Bostock has revolutionized visualization with his d3 and his seemingly infinite examples.  In another adaptation of his amazing work, I will adapt one of my favorite examples to supplement the interactive scatterplot with data supplied by R through Shiny.  Often in finance, we will use a scatterplot to explore the relationship between different asset classes or risk exposures.  This exploration becomes much more deep and meaningful when we can interact in real-time with the plot.

I thought using the technique to look at the monthly returns of Vanguard funds representing different exposures would be helpful.  A clear linear relationship immediately shows up between the equity funds (VFINX-Vanguard S&P 500, VDMIX-Vanguard Developed Markets, and VEIEX-Vanguard Emerging Markets).  Also, we can see the very beneficial effect of VBMFX-Vanguard Total US Bond throughout what we know was a tumultuous period.

Live example hosted at Glimmer (IE does not correctly render IFRAME below)

Code at Github

Shiny SVG no d3–New and Improved

The fine author Joe Cheng of RStudio Shiny suggested in this Google Groups message to use htmlOutput rather than the ugly hack in my last post R Shiny svg with no d3.  As I should have known, it works great and eliminates all the useless javascript.  Unless, you dig into the code, nothing changes, but I have posted a new glimmer live example and the code at Github.  For the ambitious, please feel free to use d3 now or other code to show how we could change colors and other aesthetics with javascript.

Tuesday, December 18, 2012

R Shiny svg with no d3

see Shiny SVG no d3–New and Improved for a better version

Paul Murrell’s Technical Report reminded me that svg in the browser does not require d3.  With his package gridSVG, we can do all sorts of wonderful things without leaving R.  I think I prefer the power of d3.js, but here is an example of R creating svg from a lattice plot with gridSVG and then sending to the browser through Shiny.

Here is the code at github.

Monday, December 17, 2012

From d3 to pdf (hopefully knitr) with R Shiny

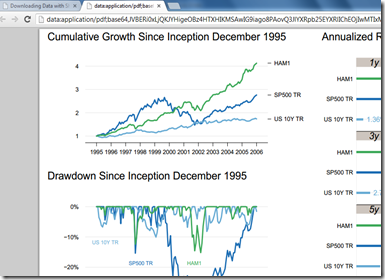
Although I think I like the d3, R, and Shiny team the best, I could definitely envision a big need for multi-page pdf reports created with R, knitr, and latex delivered to the browser with Shiny.  Shiny helpfully provides pre-built functionality to send .png charts and graphics created by R to the web.  This works especially well since most browsers offer containers for the graphics that can dynamically change.

In this quick experiment, I use the pdf() dev function from R instead of the hoped for knit2pdf to see if sending the binary pdf data is possible.  It seems the downloadHandler function from Shiny only currently handles text.  The downloadHandler function from Shiny also serves up downloads well.  I have included the code to get that to work also if you prefer this behavior.

Try it out at http://glimmer.rstudio.com/timelyportfolio/shiny-d3-pdf.  It seems to work with the newest Chrome and IE.

image

Code at Github.

Friday, December 14, 2012

d3, Shiny, and R Reporting Performance

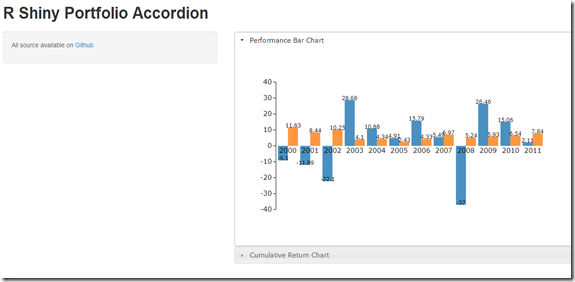
I thought it would be interesting to offer a little different example of how we can use d3, R, and Rstudio Shiny.  This time we will perform a simple example to report portfolio or index performance.  Just as a test of my progress, I also threw in a jQuery UI accordion effect.

Live example here

image

Code here

Thursday, December 13, 2012

Shiny, R, d3 Adaptation of Mike Bostock’s Calendar

The idea with all the posts http://timelyportfolio.blogspot.com/search/label/shiny was to learn both d3 and shiny by iterating through multiple experiments.  This example adaptation was my quickest yet at about 30 minutes.  Mike Bostock had done all the hard work, and all I had to do was write about 40 lines of R code to download the index data through getSymbols and Yahoo!Finance and deliver that data to d3.

Example http://glimmer.rstudio.com/timelyportfolio/shiny-d3-calendar/

Code https://github.com/timelyportfolio/shiny-d3-calendar

image

Wednesday, December 12, 2012

more d3 with shiny and R (CPI from bls.gov)

Extending the marginal success achieved in

d3 Showreel Combined with R and Shiny 

d3 and r interacting through shiny

I have converted http://bl.ocks.org/3891711 to use data supplied by an R load of http://bls.gov CPI data through Rstudio's Shiny.  The example does not work perfectly due to some NaN in the d3 path, but I wanted to publish for some feedback.

A live example is here (please be patient since it will download about 6mb before showing anything), and the code is here on Github.

image

Monday, December 10, 2012

d3 Showreel Combined with R and Shiny

Since the d3 portion of the example provide in my last post d3 and r interacting through shiny was so weak, I thought it would be interesting to combine the much more compelling Showreel Example with the same stock data.  However, this time the data will come from R getSymbols.  Also, most of the plots would be better using cumulative return data, so we will use R to convert the price data into a cumulative return series.

Almost all credit for the code contained in this example goes to Mike Bostock, and although much of the code is now gone, the structure and idea belong to Trestle Technology's Jeff Allen.

See it live in the browser at http://glimmer.rstudio.com/timelyportfolio/shiny-d3-showreel/, and all code is hosted on Github, so please play, experiment, and let me know what great things you do with this.

Friday, December 7, 2012

d3 and r interacting through shiny

I was amazed and delighted by the Reconstruct Gene Networks Using Shiny.  Jeff accomplished what I knew was possible but had absolutely no idea how to implement.  With the boost, I went to work combining his d3 force layout with my d3 experiments discussed in Hi R and Axys, I’m d3.js “Nice to Meet You” (On the Iphone).  Unfortunately, I could not figure out how to host the example at http://glimmer.rstudio.com See this live at http://glimmer.rstudio.com/timelyportfolio/shiny-d3-plot/, and for all the source code go to https://github.com/timelyportfolio/shiny-d3-plot.

Friday, November 9, 2012

Unbelievable and Amazing R Shiny–Web Parameter Test in 1.5 Hours

Life keeps getting better and better.  Yesterday, I discovered the absolutely unbelievable and amazing work RStudio has done with Shiny employing one of my favorite R packages websockets.  As proof of the ease and quality, within a couple of minutes, I was able to get it up and running.  This morning basically starting from scratch in less than 1.5 hours I was able to achieve a web-based interactive parameter test for a moving average system as my first example.

Below is a screencast of this very basic parameter testing web app.  I can only hope that this simple application can illustrate just how powerful Shiny is.  Just imagine pairing this with d3 or knitr.

R code for server.R and ui.R from GIST: