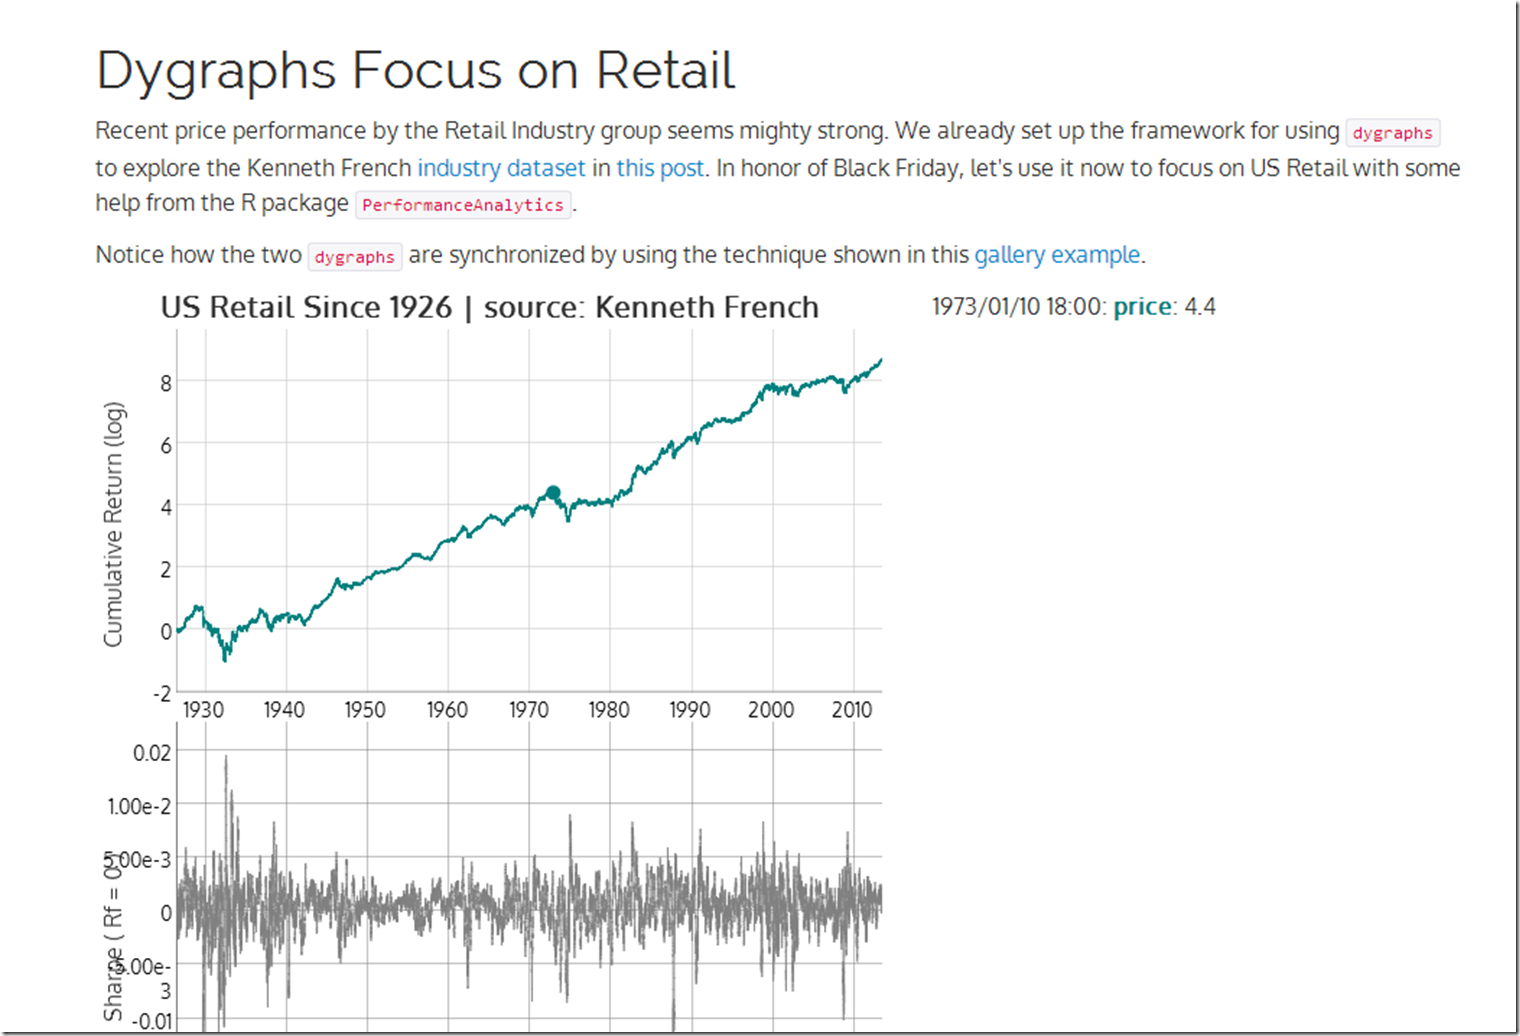
US Retail stocks have been killing it. Since the holiday season starting with Black Friday is so important to retail, let’s look at the US Retail industry price and Sharpe ratio using R rCharts and Performance analytics + javascript dygraphs. Thanks Kenneth French once again for the dataset.
Showing posts with label dygraphs. Show all posts
Showing posts with label dygraphs. Show all posts
Wednesday, November 27, 2013


Friday, November 15, 2013
Dygraphs with Bigger Data | US Industries from Kenneth French
After seeing the announcement by @lauraegerdal of the SEC’s use of dygraphs to visualize market structure, I was inspired to experiment more with the great dygraphs + rCharts. I really wanted to see how responsive dygraphs would be with a fairly large dataset. Some Kenneth French US Industry data seemed just big enough to get a good feel for dygraph’s digestive abilities. See it in action here or click on the screenshot below.

Friday, October 25, 2013
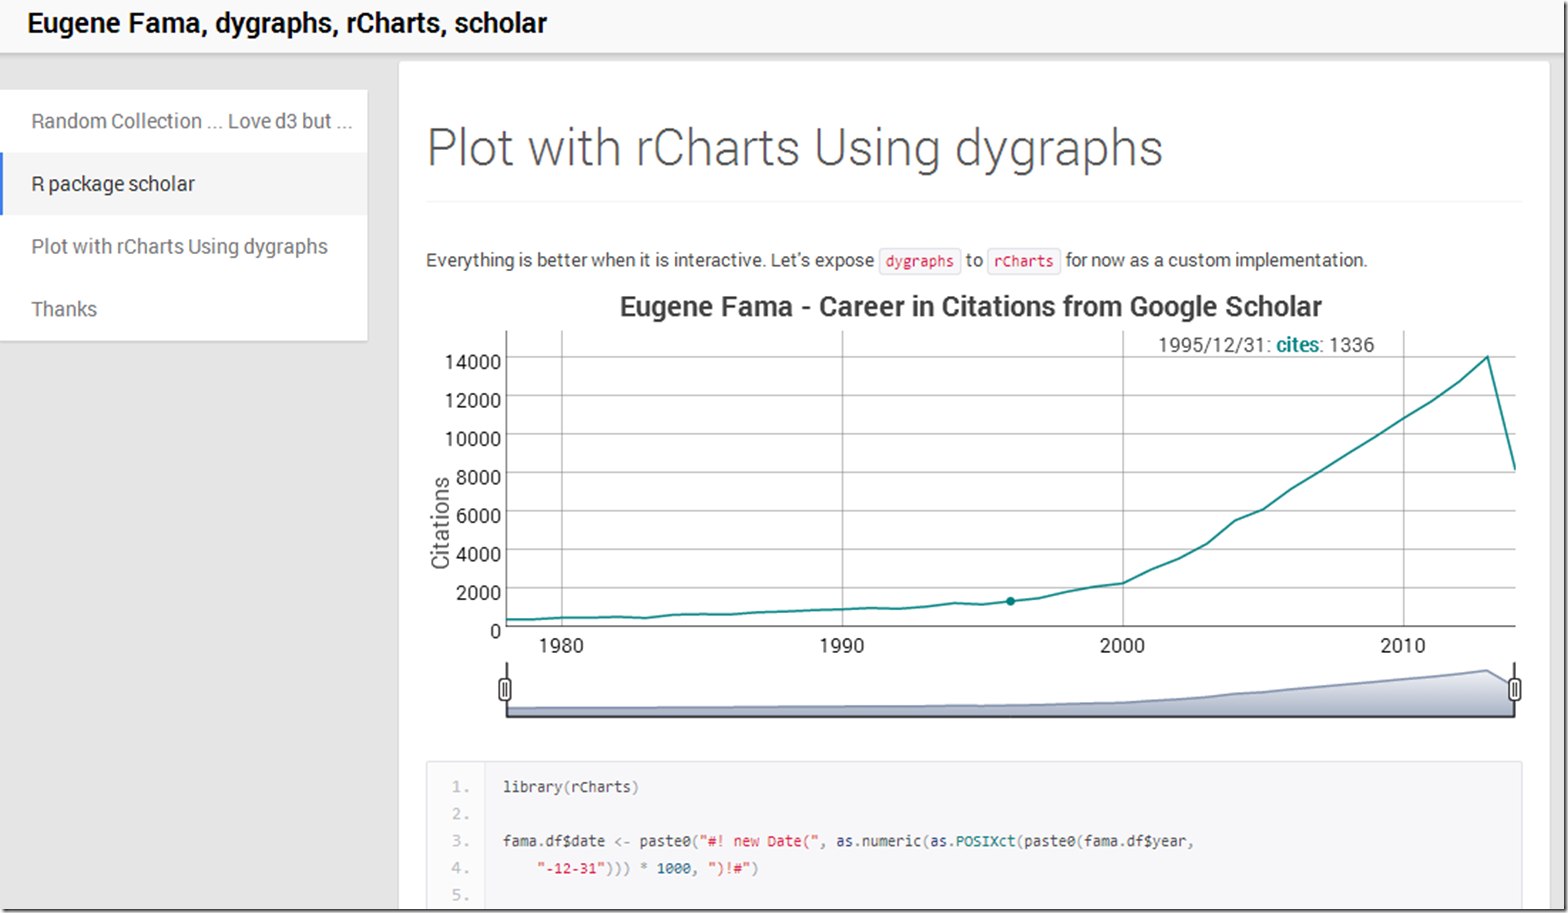
Combining Eugene Fama, rCharts, dygraphs, and scholar
What better way to end the week than to dump a lot of random topics into some experiments. Here is what happened.
Subscribe to:
Posts (Atom)