Showing posts with label reits. Show all posts

Thursday, September 20, 2012

Obviousness of REITs?

I very much enjoy papers such as

Antonacci, Gary, Risk Premia Harvesting Through Momentum (September 5, 2012). Available at SSRN: http://ssrn.com/abstract=2042750 or http://dx.doi.org/10.2139/ssrn.2042750

Faber, Mebane T., A Quantitative Approach to Tactical Asset Allocation (February 17, 2009). Journal of Wealth Management, Spring 2007. Available at SSRN: http://ssrn.com/abstract=962461

and clearly the finance community appreciates these with the first as a First place winner of the 2012 NAAIM Wagner Awards for Advancements in Active Investment Management and the second with a download rank of 2 on SSRN with 273,000 abstract views.

However, I struggle mightily with how obvious would these papers’ choice of assets been without the benefit of hindsight.  I already briefly touched on this flaw in Bonds Much Sharpe -r Than Buffett.  Of course, using what we now know is one of the best asset classes in the history of the world that has also experienced an anomalous and extremely negative correlation with equities during their distress will provide a very positive result.  Unfortunately, I have yet to find any research from the late 1970s or early 1980s that predicted such a glorious environment for bonds.

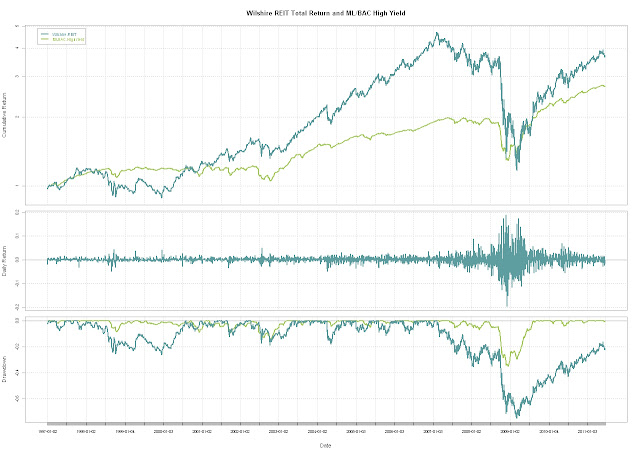
Similar but not quite as extreme, adding REITs (all my posts about REITs)  over the last 12 years in any way would almost guarantee a pleasant result.  However, REITs were not so stellar for the 15 year period 1984-1999.  Would REITs have been such an obvious choice in 1999?  Of course, if we know the future, but I’m not so sure when we only knew the past.

From TimelyPortfolio

Also, how obvious would gold have been in 1998 or how obvious would high yield have been in the early 1980s when they did not even exist? Can we expect the next 10 years to look like the last 10 years?

R code from GIST:

Wednesday, June 22, 2011

REITs for Everybody Now REITs for Nobody Part 3

THIS IS NOT INVESTMENT ADVICE.  LISTENING TO ME COULD LOSE LOTS OF MONEY.

For some additional insight to my short REITs beliefs presented in REITs for Everybody Now REITs for Nobody Part 2 and REITs for Everybody Might Now Mean REITs for Nobody, I thought we should look at the underlying commercial real estate prices with the Moody’s/REAL CPPI indexes updated today June 22.  They generously provide the data but unfortunately in zip compressed format.  I am not sure how to automate the unzip step in R Thanks to theHausdorffMetric and –Digital Dude- for showing me how to unzip files in R.  Now, we can easily analyze the unzipped csv data in R. 

From TimelyPortfolio

On a standalone basis, the index is very ugly with a new recent downturn into new lows.

From TimelyPortfolio

Let’s see how closely REITs match underlying commercial property prices.  I don’t know about you, but something doesn’t seem quite right about these next charts.

From TimelyPortfolio

R code(click to download):

require(quantmod)
require(PerformanceAnalytics)   #thanks theHausdorffMetric and -Digital Dude- for the comments
#showing how to download, unzip, and access a zip file
my.url="http://web.mit.edu/cre/research/credl/rca/MoodysREAL-2011Q1.zip"
my.tempfile<-paste(tempdir(),"\\moodys-cppi.zip",sep="")
download.file(my.url, my.tempfile, method="auto", quiet = FALSE, mode = "wb",cacheOK = TRUE)
unzip(my.tempfile,exdir = tempdir(),junkpath=TRUE)
moodyscppi <- read.csv(paste(tempdir(),"\\Monthly Returns National - All Properties.csv",sep=""))
#get date ready for xts
moodyscppi[,1] <- paste(moodyscppi[,1],
ifelse(moodyscppi[,2]<10,paste("0",moodyscppi[,2],sep=""),moodyscppi[,2]),
"01",sep="-")
moodyscppi <- as.xts(moodyscppi[,3:4],order.by=as.Date(moodyscppi[,1]))   #jpeg(filename="moodys-cppi-performance.jpg",quality=100,width=6.25, height = 5,
# units="in",res=96)
charts.PerformanceSummary(moodyscppi[,2],
main="Moody's/REAL Commercial Property Price Index")
#dev.off()   getSymbols("WILLREITIND",src="FRED") #get Wilshire REIT Total Return
getSymbols("WILLREITPR",src="FRED") #get Wilshire REIT Price
WILLREITIND <- to.monthly(WILLREITIND)[,4]
WILLREITPR <- to.monthly(WILLREITPR)[,4]
index(WILLREITIND) <- as.Date(index(WILLREITIND))
index(WILLREITPR) <- as.Date(index(WILLREITPR))
#merge returns from cppi and reit indexes
cppi_reit <- na.omit(merge(moodyscppi[,2],
ROC(WILLREITIND,n=1,type="discrete"),
ROC(WILLREITPR,n=1,type="discrete")))
colnames(cppi_reit) <- c("Moodys/REAL CPPI",
"Wilshire REIT Total Return","Wilshire REIT Price")
#jpeg(filename="moodys-cppi-reit.jpg",quality=100,width=6.25, height = 5,
# units="in",res=96)
charts.PerformanceSummary(cppi_reit,cex.legend=1.2,
main="Moodys/REAL CPPI and Wilshire REIT Indexes",
colorset=c("cadetblue","darkolivegreen3","purple"))
#dev.off()
#jpeg(filename="cppi-reit-rolling.jpg",quality=100,width=6.25, height = 6.25,
# units="in",res=96)
charts.RollingPerformance(cppi_reit,width=12,legend.loc="topleft",cex.legend=1.2,
main="Moodys/REAL CPPI and Wilshire REIT Indexes
Rolling 12 Month Return"
,
colorset=c("cadetblue","darkolivegreen3","purple"))
#dev.off()

Created by Pretty R at inside-R.org

Thursday, June 16, 2011

REITs for Everybody Now REITs for Nobody Part 2

As a quick follow-up to my first REITs for Everybody Might Now Mean REITs for Nobody, I want to look at REITs and High Yield bonds, which also might simultaneously attract conservative yield buyers and speculative beta chasers.

HYG (iShares High Yield) and IYR (iShares REIT)

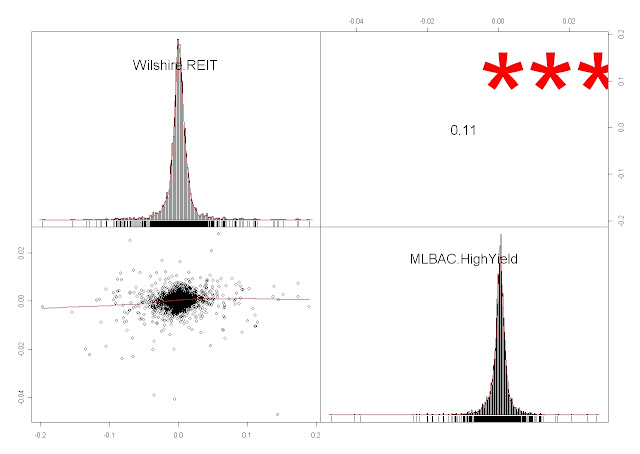
With R we can statistically analyze the similarity of REITs and High Yield.

From TimelyPortfolio

R code (click to download):

#analyze REITs and High Yield   require(quantmod)
require(PerformanceAnalytics)   #get ML/BAC High Yield Index
MLHY <- getSymbols("BAMLHYH0A0HYM2TRIV",src="FRED",auto.assign=FALSE)
#get Wilshire REIT Index
getSymbols("WILLREITIND",src="FRED")   prices <- na.omit(merge(WILLREITIND,MLHY))
colnames(prices) <- c("Wilshire.REIT","MLBAC.HighYield")
returns <- ROC(prices,n=1,type="discrete")   charts.PerformanceSummary(returns,ylog=TRUE,
main="Wilshire REIT Total Return and ML/BAC High Yield",
colorset=c("cadetblue","darkolivegreen3"))   chart.TimeSeries(runCor(returns[,1],returns[,2],n=250),
main="Wilshire REIT Total Return and ML/BAC High Yield
Rolling 1 Year Correlation"
,colorset="cadetblue")   chart.Correlation(returns)

Created by Pretty R at inside-R.org

Tuesday, June 14, 2011

REIT Momentum in Quantstrat

I took a short break from quantstrat to do some REIT analysis REITs for Everybody Might Now Mean REITs for Nobody.  Now let’s link the two by incorporating The Aleph Blog momentum bucket strategy in quantstrat.

From TimelyPortfolio

In all this, I have discovered significant weaknesses in my understanding of position sizing in quantstrat.  For testing, I would like to be able to size my position at entry to be (Account Equity at entry)/(Price of symbol).  However, it appears that the account equity calculation for each period is not made until after order entry.  Please let me know if I am missing something.  Here is my hacked workaround for some performance reporting and analysis.

From TimelyPortfolio

R code (click to download):

require(quantstrat)
require(PerformanceAnalytics)   # clear out evironment
# much cleaner thanks to Guy Yollin
rm(list=ls())
try(rm(list=ls(pos=.blotter),pos=.blotter),silent=TRUE)
try(rm(list=ls(pos=.strategy),pos=.strategy),silent=TRUE)
try(rm(list=ls(pos=.instrument),pos=.instrument),silent=TRUE)   #set up bucketing function to generate signal
bucket_signal <- function(price,nbuckets,nper) {
momscore <- price/runMean(price,n=nper)-1
breaks <- quantile(momscore, probs = seq(0, 1, 1/nbuckets),na.rm=TRUE)
buckets <- cut(momscore, breaks=breaks, labels=FALSE)
signal <- as.xts(buckets,order.by=index(price))
colnames(signal) <- "bucket_signal"
signal[is.na(signal),1] <- 0
signal
}   #get NAREIT data
#I like NAREIT since I get back to 1971
#see how to get it in previous post
#http://timelyportfolio.blogspot.com/2011/06/reits-for-everybody-might-now-mean.html
#much easier though to get Wilshire REIT since 1977 from FRED
#also it is daily instead of monthly
#i'll use this for simplicity
stock.str <- "WILLREITIND"
getSymbols(stock.str,src="FRED")
#get OHLC all filled with monthly closes
assign(stock.str,to.monthly(get(stock.str)))
index(WILLREITIND) <- as.Date(index(WILLREITIND))
#set up currency and stock
currency('USD')
stock(stock.str,currency='USD',multiplier=1)
initDate='1976-12-31'
initEq=coredata(get(stock.str)[1,4])
tradeSize = 1   #name strategy, account, and portfolio same
name_all <- "momBuckets"
#set up strategy
strat <- strategy(name_all)   #set up portfolio and account
initPortf(name=name_all,symbols=stock.str,initDate=initDate)
initAcct(name=name_all,portfolios=name_all,initDate=initDate,initEq=initEq)
initOrders(portfolio=name_all,initDate=initDate)   #set up indicator
#do bucket indicator
strat <- add.indicator(strategy = strat, name = "bucket_signal",
arguments=list(price=quote(Cl(mktdata)),nbuckets=5,nper=10),
label="bucket_signal")
#set up signal
strat <- add.signal(strategy = strat, name="sigThreshold",
arguments = list(threshold=3,column="bucket_signal",
relationship="gte",cross=TRUE),
label="bucket.gte.3")
strat <- add.signal(strategy = strat, name="sigThreshold",
arguments = list(threshold=3,column="bucket_signal",
relationship="lt",cross=TRUE),
label="bucket.lt.3")
#set up rule
strat <- add.rule(strategy=strat,name="ruleSignal",
arguments = list(sigcol="bucket.gte.3", sigval=TRUE,
ordertype='market',orderqty=tradeSize,
orderside='long', pricemethod='market', replace=FALSE),
type='enter', path.dep=TRUE)
strat <- add.rule(strategy=strat,name="ruleSignal",
arguments = list(sigcol="bucket.lt.3", sigval=TRUE,
orderqty="all", ordertype='market',
orderside='long', pricemethod='market', replace=FALSE),
type='exit', path.dep=TRUE)   #run strategy and portfolio
out <- applyStrategy(strategy=strat,portfolios=name_all)
#break up steps of applyStrategy for debugging
#strat.ind <- applyIndicators(strategy=strat,mktdata=get(stock.str))
#strat.sig <- applySignals(strategy=strat,indicators=strat.ind)
#applyRules(strategy=strat,portfolio=name_all,symbol=stock.str,
# indicators=strat.in,Dates=NULL,signals=strat.sig,mktdata=mktdata,path.dep=TRUE)     updatePortf(Portfolio=name_all,Dates=paste('::',as.Date(Sys.time()),sep=''))
#analyze performance
chart.Posn(Portfolio=name_all,Symbol=stock.str)   #unfortunately I do not know yet how to size position
#on each entry to be CurrentEquity/price
#so the compare really is not worthwhile
#this would be the preferred way
#retCompare <- merge(PortfReturns(Account=name_all)/100,
# ROC(get(stock.str)[,4],n=1,type="discrete"))
#charts.PerformanceSummary(retCompare)     #could do buy/hold comparison similar to
#blog post A Quantstrat to Build On Part 4
#but still not really applicable
#so I will hack this way
#but of course this really defeats the purpose of quantstrat
positions <- getPortfolio(name_all)$symbols$WILLREITIND$posPL[,"Pos.Qty"]
#position of 1 will get return and position of 0 will get nothing
ret <- lag(positions,k=1)*ROC(get(stock.str)[,4],n=1,type="discrete")
retCompare <- merge(ret, ROC(get(stock.str)[,4],n=1,type="discrete"))
colnames(retCompare) <- c("Strategy","Wilshire REIT")
charts.PerformanceSummary(retCompare,ylog=TRUE, cex.legend=1.25,
main="Wilshire REIT with Aleph Blog Momentum",
colorset=c("cadetblue","darkolivegreen3"))

Created by Pretty R at inside-R.org

Sunday, June 12, 2011

REITs for Everybody Might Now Mean REITs for Nobody

THIS IS MY OPINION AND ANALYSIS AND IS NOT INVESTMENT ADVICE.  YOU ARE RESPONSIBLE FOR YOUR OWN GAINS AND LOSSES.

I think REITs traditionally attract conservative dividend investors (grandparents), but due to their recent behavior, REITs also attract beta chasers (hedge funds  and traders).  This additional demand has made REITs overvalued and even more volatile.  Both sets of REIT buyers might not want to buy now.

In terms of attractiveness to the traditional conservative dividend buyer, REITs seem unattractive on both an absolute and relative yield basis.

From TimelyPortfolio

The newly found volatility of REITs for the beta chaser works well in a bullish stock market, but of course works in reverse on the downside.  This volatility also could easily scare the conservative long-term dividend buyer already concerned about low yields.

From TimelyPortfolio

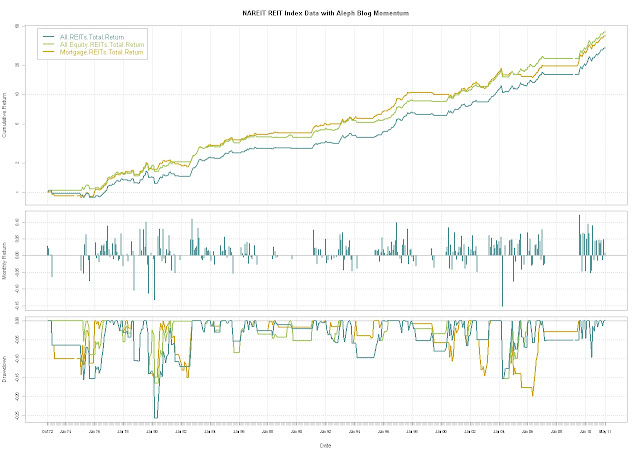
One way to potentially dampen volatility would be to use a momentum type system as suggested by The Aleph Blog on REITs How to Make More Returns on REITs.  Results are pretty good.  Like the author, I was skeptical about his approach, since we would have no advance knowledge of momentum quintiles in 1971, but interestingly if we use the Dow Jones Industrial Average momentum quintiles 1896-1971, we would get very similar out of sample REIT results.

From TimelyPortfolio

Please let me know what you think.

R code (click to download):

require(quantmod)
require(PerformanceAnalytics)  
#get NAREIT data
#I like NAREIT since I get back to 1971
#much easier though to get Wilshire REIT from FRED
#also it is daily instead of monthly
#getSymbols("WILLREITIND",src="FRED") will do this
require(gdata)
reitURL <- "http://returns.reit.com/returns/MonthlyHistoricalReturns.xls"
reitExcel <- read.xls(reitURL,sheet="Data",pattern="All REITs",stringsAsFactors=FALSE)
#clean up dates so we can use xts functionality later
datetoformat <- reitExcel[,1]
datetoformat <- paste(substr(datetoformat,1,3),"-01-",substr(datetoformat,5,6),sep="")
datetoformat <- as.Date(datetoformat,format="%b-%d-%y")
reitExcel[,1] <- datetoformat    
#############now start the yield analysis#####################
#get REIT yield
reitYield <- as.xts(as.numeric(reitExcel[4:NROW(reitExcel),7]),
order.by=reitExcel[4:NROW(reitExcel),1])
######get BAA and 10y from Fed to compare
getSymbols("BAA",src="FRED")
getSymbols("GS10",src="FRED")
######get SP500 yield from some multpl.com
##fantastic site with easily accessible historical information
spYield <- read.csv("http://www.multpl.com/s-p-500-dividend-yield/s-p-500-dividend-yield.csv")
spYield <- as.xts(spYield[,2],order.by=as.Date(spYield[,1]))
yieldCompare <- na.omit(merge(reitYield,spYield,BAA,GS10))
chart.TimeSeries(yieldCompare, legend.loc = "topleft",cex.legend=1.2,lwd=3,
main="Yield Comparison of REITs with S&P500, BAA Yield, and US 10y Yield",
colorset = c("cadetblue","darkolivegreen3","goldenrod","gray70"))
#get yield spread information
yieldSpread <- yieldCompare[,1:3]
yieldSpread[,1] <- yieldCompare[,1]-yieldCompare[,2]
yieldSpread[,2] <- yieldCompare[,1]-yieldCompare[,3]
yieldSpread[,3] <- yieldCompare[,1]-yieldCompare[,4]
colnames(yieldSpread) <- c("REIT Yield - S&P500 Yield",
"REIT Yield - BAA Yield","REIT Yield - US 10y Yield")
chart.TimeSeries(yieldSpread, legend.loc = "topleft",cex.legend=1.2,lwd=3,
main="Yield Spreads of REITs with S&P500, BAA Yield, and US 10y Yield",
colorset = c("cadetblue","darkolivegreen3","goldenrod"))    
#############now start the return analysis###################
#shift colnames over 1
colnames(reitExcel) <- colnames(reitExcel)[c(1,1:(NCOL(reitExcel)-1))]
#get dates and return columns
reitData <- reitExcel[,c(3,24,38)]
#name columns
colnames(reitData) <- c(paste(colnames(reitExcel)[c(3,24,38)],".Total.Return",sep=""))
reitData <- reitData[3:NROW(reitData),]
#erase commas
col2cvt <- 1:NCOL(reitData)
reitData[,col2cvt] <- lapply(reitData[,col2cvt],function(x){as.numeric(gsub(",", "", x))})
#create xts
reitData <- as.xts(reitData,order.by=reitExcel[3:NROW(reitExcel),1])
#######get sp500 to compare beta and other measures
getSymbols("SP500",src="FRED")
SP500 <- to.monthly(SP500)[,4]
#get 1st of month to align when we merge
index(SP500) <- as.Date(index(SP500))
#merge REIT and S&p
returnCompare <- na.omit(merge(reitData,SP500))
returnCompare <- ROC(returnCompare,n=1,type="discrete")
charts.RollingRegression(returnCompare[, 1:3], returnCompare[,4],
width=36,lwd = 3,legend.loc = "topleft",cex.legend=1.2,
main="NAREIT REIT Indexes Compared to the S&P 500
36 month Rolling"
,
colorset=c("cadetblue","darkolivegreen3","goldenrod"))
chart.RollingPerformance(returnCompare,
FUN="Return.annualized",width=36,lwd = 3,legend.loc = "topleft",cex.legend=1.2,
main="NAREIT REIT Indexes Compared to the S&P 500
36 month Rolling Return"
,
colorset=c("cadetblue","darkolivegreen3","goldenrod","gray70"))
chart.RiskReturnScatter(returnCompare["1971::2003"],
lwd = 3,legend.loc = "topleft",cex.legend=1.2,
main="NAREIT REIT Indexes Compared to the S&P 500 1971-2003",
colorset=c("cadetblue","darkolivegreen3","goldenrod","gray70"))
chart.RiskReturnScatter(returnCompare["2004::"],
lwd = 3,legend.loc = "topleft",cex.legend=1.2,
main="NAREIT REIT Indexes Compared to the S&P 500 Since 2004",
colorset=c("cadetblue","darkolivegreen3","goldenrod","gray70"))
charts.PerformanceSummary(returnCompare,ylog=TRUE,
lwd = 3,legend.loc = "topleft",cex.legend=1.2,
main="NAREIT REIT Indexes Compared to the S&P 500",
colorset=c("cadetblue","darkolivegreen3","goldenrod","gray70"))        
#############now start the bucket analysis###################
#bucket momentum as described by Aleph Blog
#get 10 month moving average
#set up avg with same as reitData
avg <- reitData[,1:3]
avg <- as.data.frame(avg)
avg[,1:3] <- lapply(reitData[,1:3],runMean,n=10)
avg <- as.xts(avg)
#get % above 10 month moving average
momscore <- reitData/avg-1
#break into 5 evenly distributed by frequency quintiles
#get signal into 3 column xts
signal <- momscore
for(i in 1:3) {
breaks <- quantile(momscore[,i], probs = seq(0, 1, 0.20),na.rm=TRUE)
#use default labels=TRUE to see how this works
buckets <- cut(momscore[,i], include.lowest=TRUE, breaks=breaks)
#store so we can see later
ifelse(i==1,bucket_ranges <- names(table(buckets)),
bucket_ranges <- rbind(bucket_ranges,names(table(buckets))))
#now use labels=FALSE to return 1-5 based on quintile
buckets <- cut(momscore[,i], breaks=breaks, labels=FALSE)
signal[,i] <- as.xts(buckets,order.by=index(signal))
#move forward by 1
}
#name bucket_ranges with reit column names
rownames(bucket_ranges)<-colnames(reitData)
signal <- lag(signal,k=1)
ret <- signal
#showing my R weakness here and had to go back to for..next
for(i in 1:3) {
ret[,i] <- ifelse(signal[,i] >= 3,1,0) * ROC(reitData[,1],1,type="discrete")
}
charts.PerformanceSummary(ret,ylog=TRUE,legend.loc = "topleft",cex.legend=1.2,
main="NAREIT REIT Index Data with Aleph Blog Momentum",
colorset=c("cadetblue","darkolivegreen3","goldenrod"))    
getSymbols("DJIA",src="FRED")
#examine DJIA quantiles prior to 1973 to see if we could
#know in advance what possible REIT quantiles would work
DJIA <- to.monthly(DJIA)["1896::1971",4]
momDJIA <- DJIA/runMean(DJIA,n=10)-1
breaks <- quantile(momDJIA, probs = seq(0, 1, 0.20),na.rm=TRUE)
buckets <- cut(momDJIA, breaks=breaks)
table(buckets)  
#what happens if we apply the DJIA prior to 1973 buckets to the REITs
ret <- merge(ret,ret)
for(i in 1:3) {
#if REITs > 3.95% above 10 month moving average then long
#3.95% is the lower end of the DJIA 1896-1971 3 momentum quantile
ret[,i+3] <- lag(ifelse(momscore[,i] >= 0.0395,1,0),1) * ROC(reitData[,1],1,type="discrete")
}
colnames(ret)[4:6]<-paste(colnames(reitData[,1:3])," with DJIA buckets",sep="")
#much much better than I expected
charts.PerformanceSummary(ret,ylog=TRUE,legend.loc = "topleft",cex.legend=1.2,
main="NAREIT REIT Index Data with Aleph Blog Momentum but DJIA Momentum Buckets",
colorset=c("cadetblue","darkolivegreen3","goldenrod",
"coral","darkorchid","darkolivegreen"))

Created by Pretty R at inside-R.org