Showing posts with label gridSVG. Show all posts

Wednesday, August 14, 2013

gridSVG Multi-line Data Bind with d3–US Treasury Yields

If you have not read the other posts on gridSVG and d3, I recommend reading those before progressing to this one.

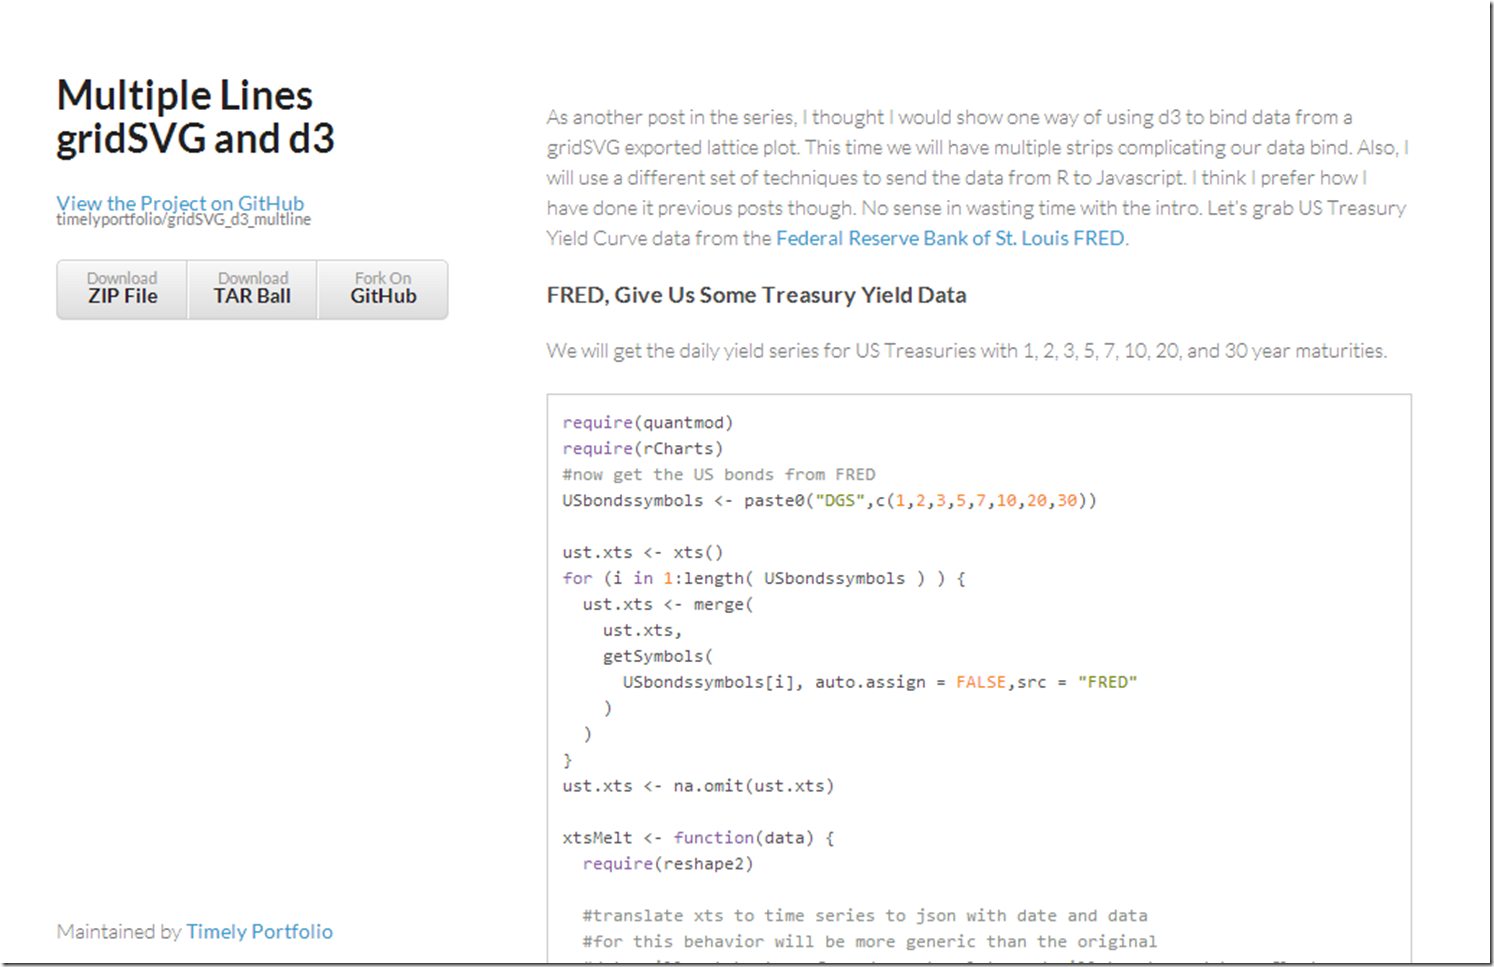
Facets or strips are one of my favorite features of lattice and ggplot2, so of course I want to extend our d3 reverse data bind to support these small multiples.  Let’s see one way of accomplishing this.  For a short explanation of the process, click here or on the screenshot below.  If you just like yield curve data, I think you will enjoy the graph which I have embedded below.

screenshot of tutorial

Friday, August 9, 2013

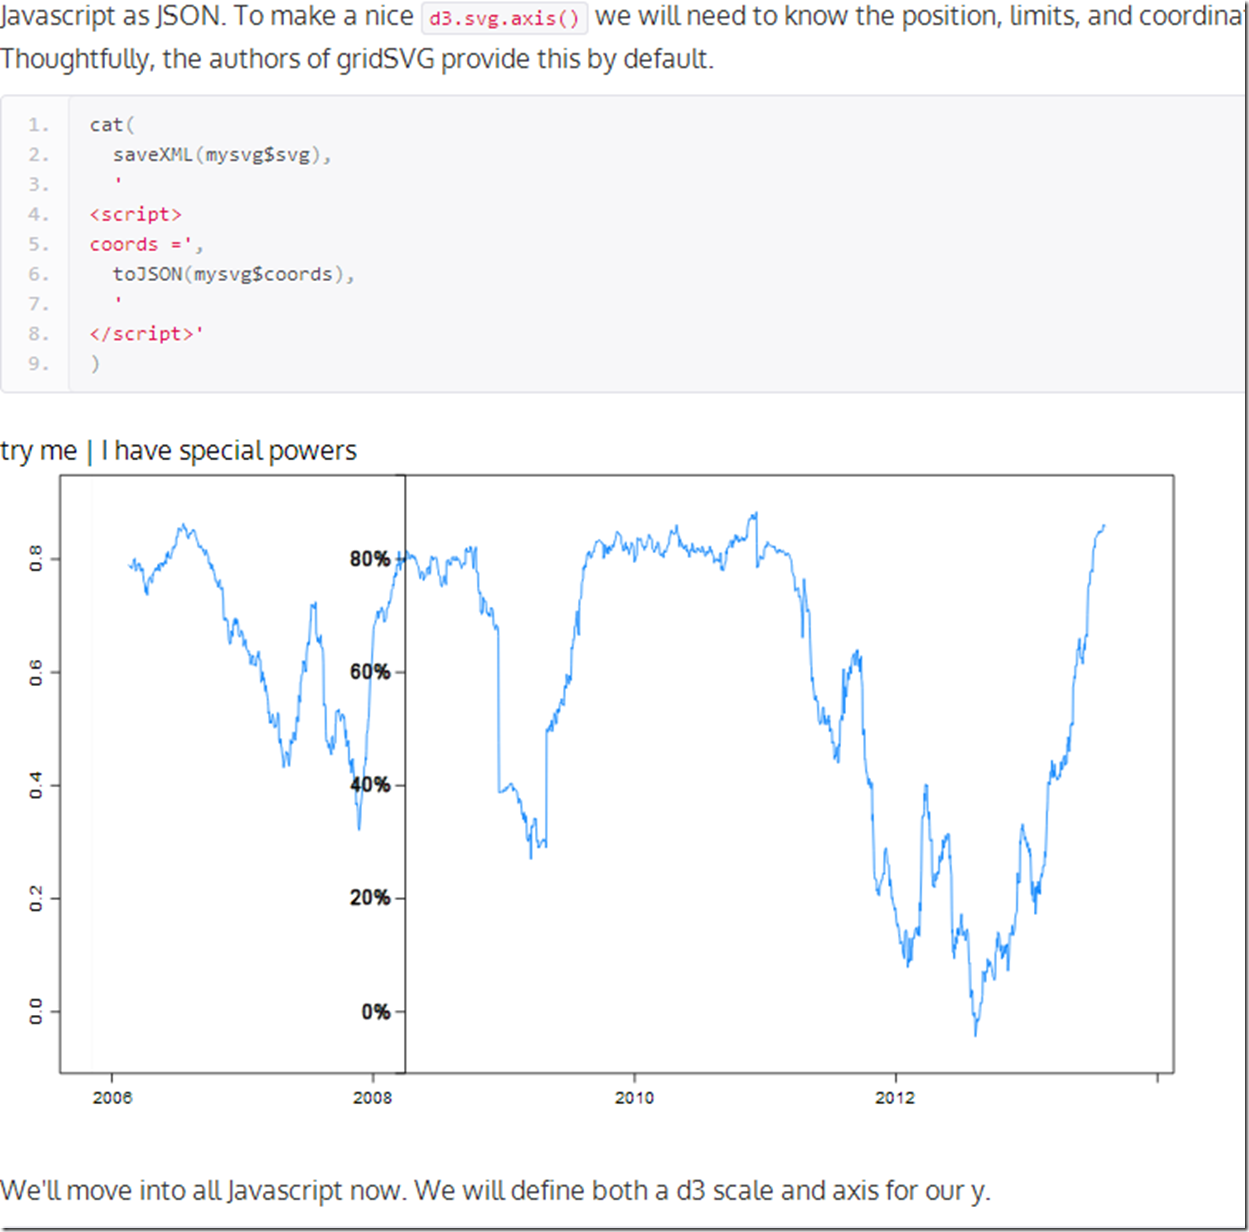
PIMCO Rolling Correlation, d3, R, gridSVG, lattice | Gets An Axis

Where else will you hear Pimco, rolling correlation, R, gridSVG, lattice, and d3 all in one post?  Let’s mix them all together to see what might happen.  For those here for the geekery, we will add a d3 axis for our y and it will follow the mouse.  For those who care nothing about d3 and R, you might like the chart too since it plots the 90 day rolling correlation between Pimco Total Return and Pimco All Asset Authority  .  Click here if or on the screenshot below. to see the live version.


image


At some point I will find the limits of my creativity and knowledge.  Please give me some ideas.

Thursday, August 8, 2013

R/gridSVG/d3 Line Reverse Data Bind

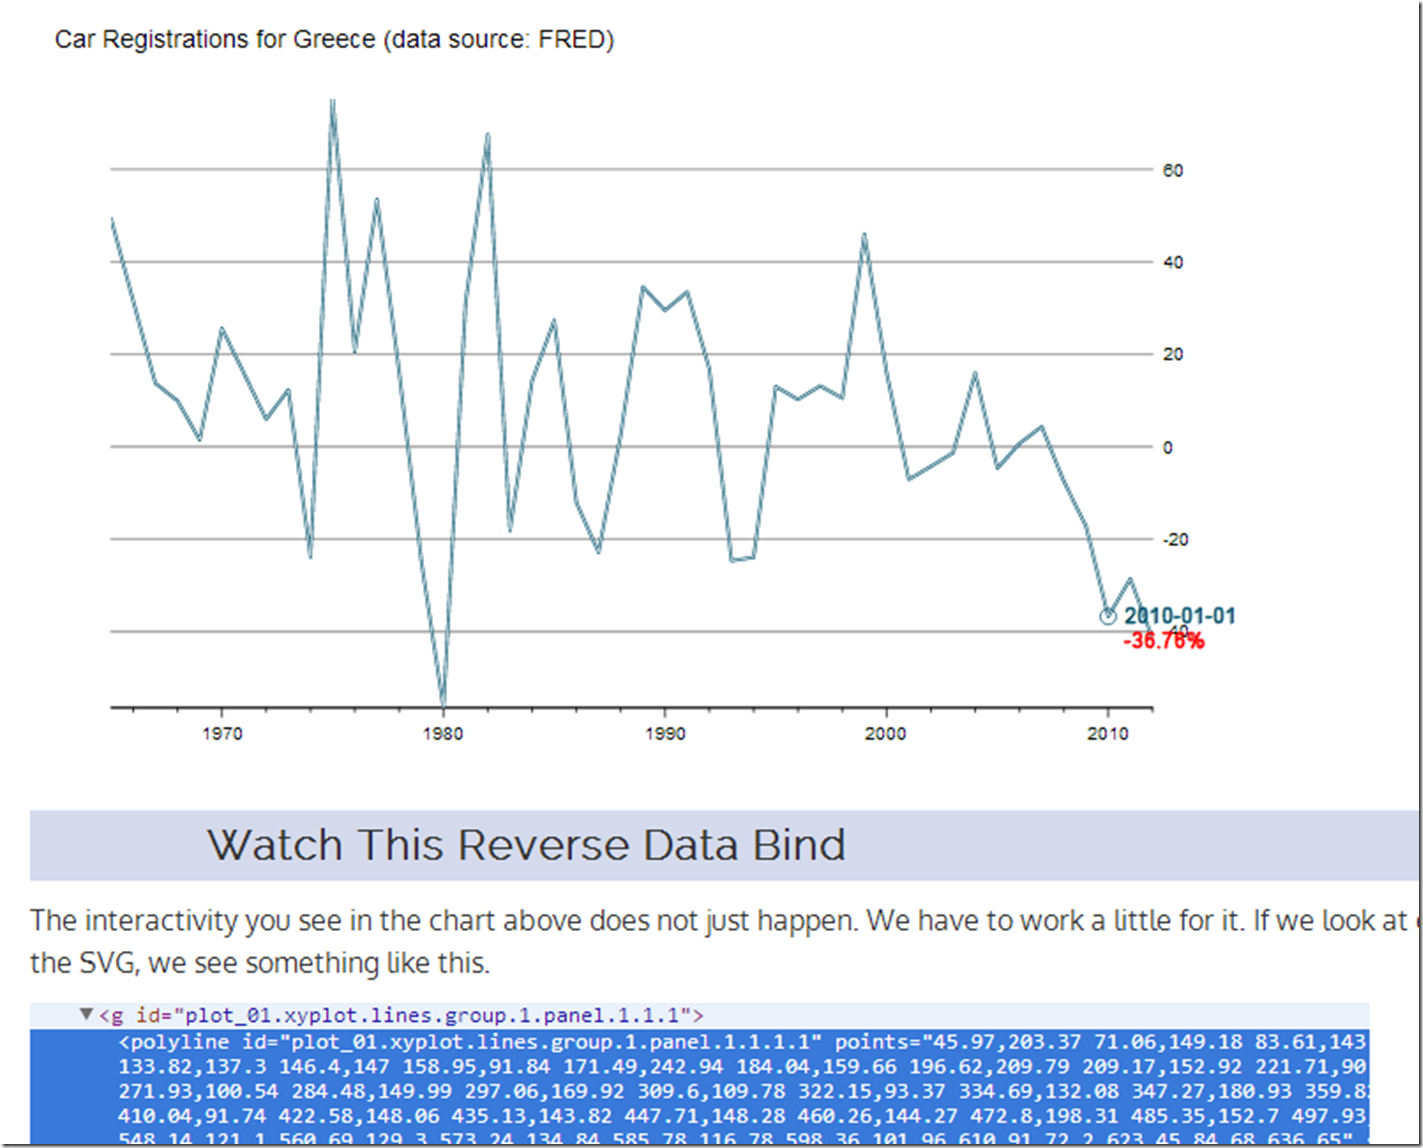
I veer from finance to tech, so let’s use some data from FRED/OECD this time.  I do not think I need to comment much on what has happened to New Car Registrations in Greece.

Reverse data binding a line plot from ggplot2 or lattice is slightly more difficult than what we saw in the last post I Want ggplot2/lattice and d3 (gridSVG–The Glue).  Here is a quick tutorial on one way we can accomplish this.  Click on this link or the screenshot below.

image

As always, this is fully reproducible.  See the code on Github.

Wednesday, August 7, 2013

ggplot2 meet d3

With great libraries, just a couple lines of code can do amazing things.  For instance, let’s limit ourselves to less than 10 lines of code and see what ggplot2 and d3 can do.  We will use gridSVG as discussed in yesterday’s post I Want ggplot2/lattice and d3 (gridSVG–The Glue) to expose ggplot2 to d3.  Thanks Hadley Wickham, Mike Bostock, Paul Murrell, Simon Potter, and George Bull/Sharp Statistics.

If the iframe does not appear below, click here.

Just think what we can do if we remove our 10 line code limit.

#get the latest version of gridSVG
#install.packages("gridSVG", repos="http://R-Forge.R-project.org")

require(ggplot2)
require(gridSVG)

#draw a ggplot2 graph
#thanks http://sharpstatistics.co.uk/r/ggplot2-guide/
p <- ggplot(iris, aes(Sepal.Length, Sepal.Width)) + geom_point()
p + facet_grid(. ~ Species) + stat_smooth(method = "lm")

#define a simple html head template
htmlhead <-
'<!DOCTYPE html>
<head>
<meta charset = "utf-8">
<script src = "http://d3js.org/d3.v3.js"></script>
</head>

<body>
'


#use gridSVG to export our plot to SVG
mysvg <- grid.export("panzoom1.svg")


#define a simple pan zoom script using d3
panzoomScript <-
' <script>
var svg = d3.selectAll("#gridSVG");
svg.call(d3.behavior.zoom().scaleExtent([1, 8]).on("zoom", zoom))

function zoom() {
svg.attr("transform", "translate(" + d3.event.translate + ")scale(" + d3.event.scale + ")");
}
</script>
</body>
'


#combine all the pieces into an html file
sink("panzoom_ggplot2.html")
cat(htmlhead,saveXML(mysvg$svg),panzoomScript)
#close our file
sink(file=NULL)


Tuesday, August 6, 2013

I Want ggplot2/lattice and d3 (gridSVG–The Glue)

I really like interactive graphics, especially when they come straight from R.  I posted a lot about rCharts, but it is not the only way.  In my mind there are three types of glue to link R to SVG/HTML/Javascript:

  1. Let R do the data and then send the data to Javascript to create the SVG graphics. This is the process employed by rCharts, clickme,d3network, googleVis, gigvis, and tabplotd3.

  2. Let R both do the data and render the graph then export the SVG to get interactivity from Javascript. We see this with the new and improved gridSVG and the predecessor SVGAnnotation.

  3. Use 1. or 2. and then maintain bidirectional communication between R and Javascript through shiny, Rook, or some other web server type interface.

Let’s think about method 2.  R has ggplot2 and lattice.  Javascript has d3.  I want both.

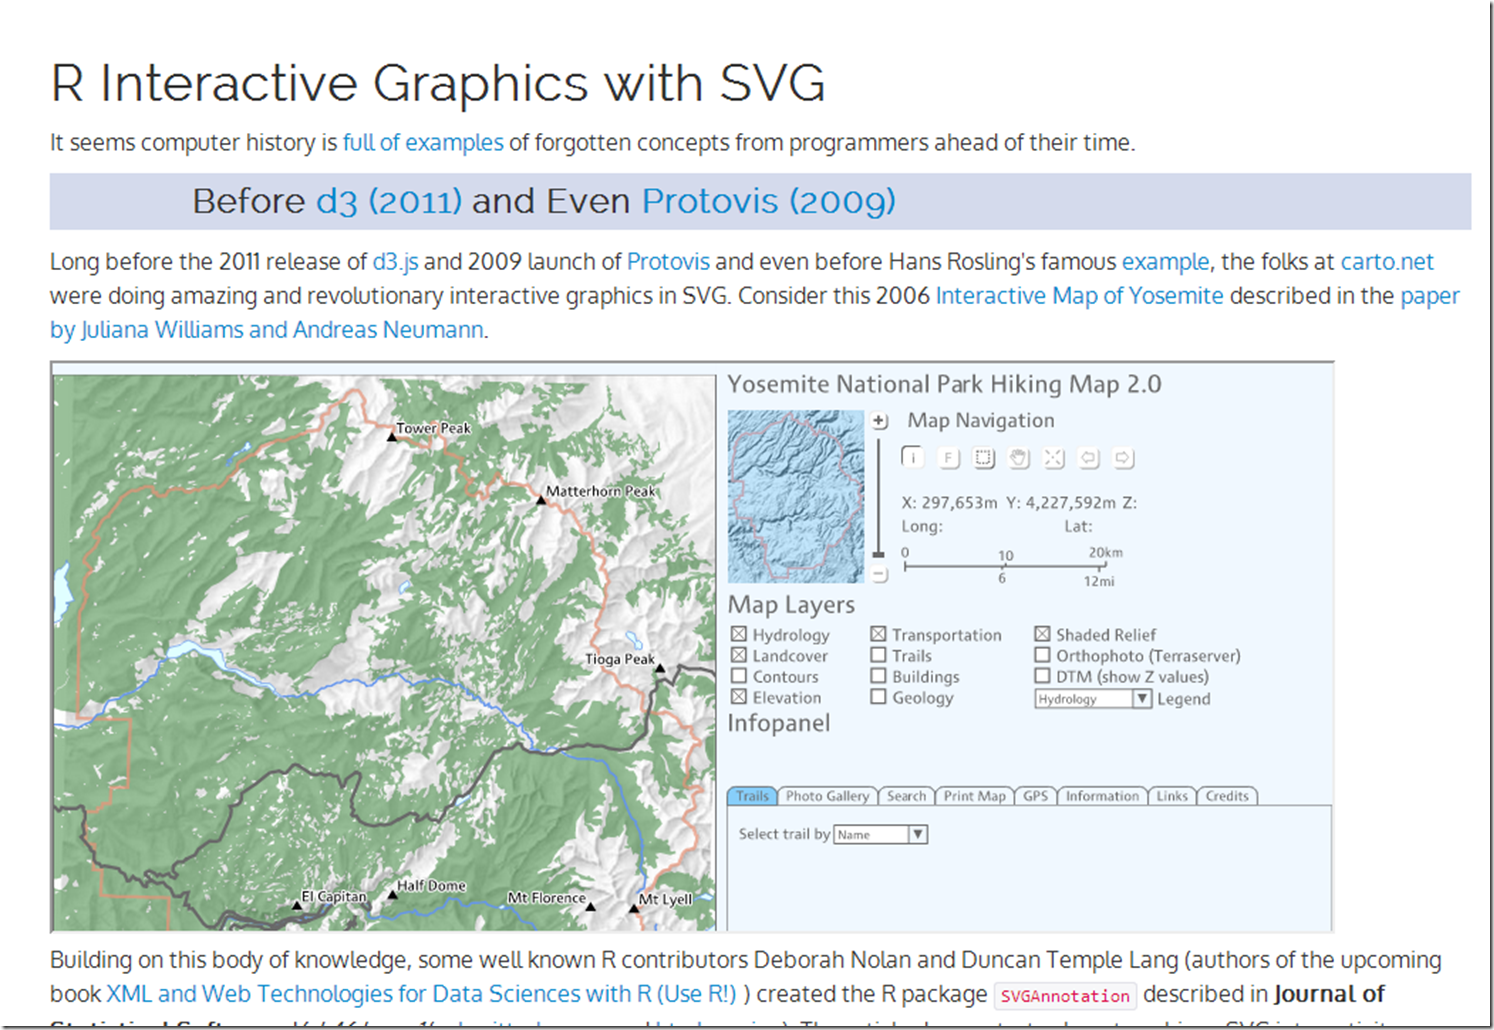
We R users are very spoiled by the ggplot2 and lattice engines that rival or beat the plotting libraries of any language.  Wouldn’t it be nice to have all the power of these engines to create interactive graphs?  Well, Paul Murrell, the author of grid (platform of ggplot2 and lattice), wrote gridSVG to do just that.  Over the last couple of years, Simon Potter under the guidance of Murrell has refined gridSVG for his honours project.  It is now a full-featured robust package capable of sending even your most complicated ggplot2 and lattice masterpieces to SVG.   gridSVG can do amazing things on his own, but I, of course, wanted to combine gridSVG with d3.  Click here or on the screenshot below to see a walkthrough applying a little gridSVG glue to ggplot2 and d3.
image

Thanks to Paul Murrell, Simon Potter, Hadley Wickham, Mike Bostock, Duncan Temple Lang, Deborah Nolan, Juliana Williams, Andreas Neumann, Ramnath Vaidyanathan and all the folks along the way that have made this possible.