Showing posts with label crb. Show all posts

Tuesday, May 24, 2011

Utility Spread and Financial Turbulence Part 2 with Utility Slope

THIS IS NOT INVESTMENT ADVICE.  YOU ARE RESPONSIBLE FOR YOUR OWN GAINS AND LOSSES.

I did not intend for this to be a two-part series but I just could not be complacent with Utility Spread and Financial Turbulence (for avid readers, there was a small error in this post that is now corrected).  Since the change was so easy and the results so much better, I thought I should share.

In previous posts, I set up a very basic relative strength approach by using the 12 month slope (linear beta) to choose the stronger performer.  The improvements from adding this relative strength technique to my original Great FAJ Article on Statistical Measure of Financial Turbulence system were substantial as seen in Great FAJ Article on Statistical Measure of Financial Turbulence Part 3.  If the technique has helped in the past and I already know how to do the calculation, I figured I should at least try to apply it to the Utility Spread.  Now when turbulence is low, invest in the stronger of the S&P 500 and CRB, but when turbulence is high, use the Utility Spread only if its 12 month slope is positive.  If everything is blowing up (turbulence high) and utilities are not defensive (slope is negative), then use the US 10y Treasury as your last resort.  Lots of rules but they intuitively make sense to me.  Drawdown remains higher than I would like.
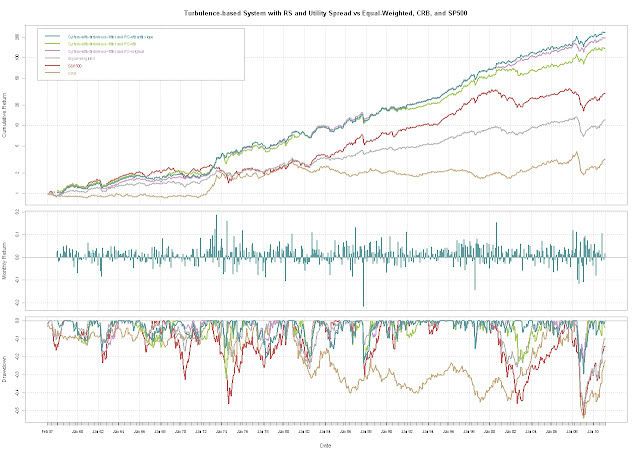
From TimelyPortfolio

R code (thanks patrick for the comment to make code more readable):

#cleaned up the code to eliminate leftovers from previous posts and studies
#see http://timelyportfolio.blogspot.com for the history and older code   require(quantmod)
require(PerformanceAnalytics)   #get data from St. Louis Federal Reserve (FRED)
getSymbols("GS20",src="FRED") #load 20yTreasury; 20y has gap 86-93; 30y has gap in early 2000s
getSymbols("GS30",src="FRED") #load 30yTreasury to fill 20y gap 86-93
getSymbols("GS10",src="FRED") #load 10yTreasury
getSymbols("BAA",src="FRED") #load BAA
getSymbols("SP500",src="FRED") #load SP500
#now Dow Jones Indexes
getSymbols("DJIA",src="FRED") #load daily Dow Jones Industrial
getSymbols("DJUA",src="FRED") #load daily Dow Jones Utility   DJUADJIA <- DJUA/DJIA   #get CRB data from a csv file
CRB <- as.xts(read.csv("crb.csv",row.names=1))[,1]   #fill 20y gap from discontinued 20y Treasuries with 30y
GS20["1987-01::1993-09"] <- GS30["1987-01::1993-09"]   #do a little manipulation to get the data lined up on monthly basis
SP500 <- to.monthly(SP500)[,4]
GS10 <- to.monthly(GS10)[,4]
DJUADJIA <- to.monthly(DJUADJIA)[,4]
#get monthly format to yyyy-mm-dd with the first day of the month
index(SP500) <- as.Date(index(SP500))
index(GS10) <- as.Date(index(GS10))
index(DJUADJIA) <- as.Date(index(DJUADJIA))
#my CRB data is end of month; could change but more fun to do in R
CRB <- to.monthly(CRB)[,4]
index(CRB) <- as.Date(index(CRB))   #let's merge all this into one xts object; CRB starts last in 1956
assets <- na.omit(merge(GS20,SP500,CRB,DJUADJIA))
#use ROC for SP500 and CRB and momentum for yield data
assetROC <- na.omit(merge(momentum(assets[,1])/100,ROC(assets[,2:4],type="discrete")))   ############Turbulence calculation
#get Correlations
corrBondsSp <- runCor(assetROC[,1],assetROC[,2],n=7)
corrBondsCrb <- runCor(assetROC[,1],assetROC[,3],n=7)
corrSpCrb <- runCor(assetROC[,2],assetROC[,3],n=7)
#composite measure of correlations between asset classes and roc-weighted correlations
assetCorr <- (corrBondsSp+corrBondsCrb+corrSpCrb+
(corrBondsSp*corrSpCrb*assetROC[,2])+
(corrBondsCrb*corrSpCrb*assetROC[,3])-
assetROC[,1])/6
#sum of ROCs of asset classes
assetROCSum <- assetROC[,1]+assetROC[,2]+assetROC[,3]
#finally the turbulence measure
turbulence <- abs(assetCorr*assetROCSum*100)
colnames(turbulence) <- "Turbulence-correlation"
############   ############Get Bond Return Data
#get bond returns to avoid proprietary data problems
#see previous timelyportfolio blogposts for explanation
#probably need to make this a function since I will be using so much
require(RQuantLib)
GS10pricereturn <- GS10 #set this up to hold price returns   GS10pricereturn[1,1] <- 0
colnames(GS10pricereturn) <- "BondPriceReturn"
#I know I need to vectorize this but not qualified enough yet
#Please feel free to comment to show me how to do this
for (i in 1:(NROW(GS10)-1)) {
GS10pricereturn[i+1,1] <- FixedRateBondPriceByYield(yield=GS10[i+1,1]/100,issueDate=Sys.Date(),
maturityDate= advance("UnitedStates/GovernmentBond", Sys.Date(), 10, 3),
rates=GS10[i,1]/100,period=2)[1]/100-1
}   #interest return will be yield/12 for one month
GS10interestreturn <- lag(GS10,k=1)/12/100
colnames(GS10interestreturn) <- "BondInterestReturn"   #total return will be the price return + interest return
GS10totalreturn <- GS10pricereturn + GS10interestreturn
colnames(GS10totalreturn) <- "BondTotalReturn"
assetROC <- na.omit(merge(GS10totalreturn,ROC(assets[,2:4],type="discrete")))
############   ############System building
#wish I could remember where I got some of this code
#most likely candidate is www.fosstrading.com
#please let me know if you know the source
#so I can give adequate credit   #let's use basic relative strength to pick sp500 or crb
#know I can do this better in R but here is my ugly code
#to calculate 12 month slope of sp500/crb and djua/djia
width=12
for (i in 1:(NROW(assets)-width)) {
#get sp500/crb slope
model <- lm(assets[i:(i+width),2]/assets[i:(i+width),3]~index(assets[i:(i+width)]))
ifelse(i==1,assetSlope <- model$coefficients[2],assetSlope <- rbind(assetSlope,model$coefficients[2]))
#get djua/djia slope; already calculated ratio so just take that
model_util <- lm(assets[i:(i+width),4]~index(assets[i:(i+width)]))
ifelse(i==1,assetSlopeUtil <- model_util$coefficients[2],assetSlopeUtil <- rbind(assetSlopeUtil,model_util$coefficients[2]))
}
assetSlope <- xts(cbind(assetSlope),order.by=index(assets)[(width+1):NROW(assets)])
assetSlopeUtil <- xts(cbind(assetSlopeUtil),order.by=index(assets)[(width+1):NROW(assets)])
assetSlope <- merge(assetSlope,assetSlopeUtil)
#use turbulence to determine in or out of equal-weighted sp500 and crb
signal <- ifelse(turbulence>0.8,0,1)   #use slope of sp500/crb to determine sp500 or crb
signal2 <- ifelse(assetSlope[,1]>0,1,2)   #lag signals
#if we knew what would happen tomorrow, we can eliminate all this effort
signal <- lag(signal,k=1)
signal[1] <- 0
signal2 <- lag(signal2,k=1)
signal2[1] <- 0   signals_returns <- merge(signal,signal2,assetROC,assetSlope)
#get sp500 or crb return based on slope when turbulence low or use bonds as cash
ret <- ifelse(signals_returns[,2]==1&signals_returns[,1]==1,signals_returns[,4],
ifelse(signals_returns[,2]==2&signals_returns[,1]==1,signals_returns[,5],
signals_returns[,3]))
#get sp500 or crb return based on slope when turbulence low or use utility spread as cash
ret_util <- ifelse(signals_returns[,2]==1&signals_returns[,1]==1,signals_returns[,4],
ifelse(signals_returns[,2]==2&signals_returns[,1]==1,signals_returns[,5],
signals_returns[,6]))
#get sp500 or crb return based on slope when turbulence low or use utility spread
#as cash only if slope positive
ret_util_slope <- ifelse(signals_returns[,2]==1&signals_returns[,1]==1,signals_returns[,4],
ifelse(signals_returns[,2]==2&signals_returns[,1]==1,signals_returns[,5],
ifelse(signals_returns[,8]>0,signals_returns[,6],signals_returns[,3])))
ret_util[1] <- 0
ret_util_slope[1] <- 0   #get system performance
system_perf_rs <- ret
system_perf_rs_util <- ret_util
system_perf_rs_util_slope <- ret_util_slope   perf_comparison <- merge(system_perf_rs_util_slope,system_perf_rs_util,system_perf_rs,(assetROC[,2]+assetROC[,3])/2,assetROC[,2],assetROC[,3])
colnames(perf_comparison) <- c("System-with-turbulence-filter and RS-util with slope",
"System-with-turbulence-filter and RS-util", "System-with-turbulence-filter and RS-original",
"Equal-weighted","S&P500","CRB")   charts.PerformanceSummary(perf_comparison,ylog=TRUE,
main="Turbulence-based System with RS and Utility Spread vs Equal-Weighted, CRB, and SP500",
colorset=c("cadetblue","darkolivegreen3","plum3","gray70","indianred","burlywood3"))

Created by Pretty R at inside-R.org

Monday, May 23, 2011

Utility Spread and Financial Turbulence

THIS IS NOT INVESTMENT ADVICE.  YOU ARE RESPONSIBLE FOR YOUR OWN GAINS AND LOSSES.

In Long XLU Short SPY Part 2 (More History), I explored the defensive nature of the spread and its potential as a bond substitute in troublesome periods for stocks.  I thought it would be interesting to see what happens if we use the spread as our cash position in the Great FAJ Article on Statistical Measure of Financial Turbulence Part 3 system.  Unfortunately, the use of the spread on price returns as cash does not benefit the system as much as bonds as cash, but I still thought it might encourage some additional reader thought on the spread and its potential uses.

From TimelyPortfolio

R code:

require(quantmod)
require(PerformanceAnalytics)

#get data from St. Louis Federal Reserve (FRED)
getSymbols("GS20",src="FRED") #load 20yTreasury; 20y has gap 86-93; 30y has gap in early 2000s
getSymbols("GS30",src="FRED") #load 30yTreasury to fill 20y gap 86-93
getSymbols("BAA",src="FRED") #load BAA
getSymbols("SP500",src="FRED") #load SP500
#now Dow Jones Indexes
getSymbols("DJIA",src="FRED") #load daily Dow Jones Industrial
getSymbols("DJUA",src="FRED") #load daily Dow Jones Utility

DJUADJIA<-DJUA/DJIA

#get CRB data from a csv file
CRB<-as.xts(read.csv("crb.csv",row.names=1))[,1]

#fill 20y gap from discontinued 20y Treasuries with 30y
GS20["1987-01::1993-09"]<-GS30["1987-01::1993-09"]

#do a little manipulation to get the data lined up on monthly basis
SP500<-to.monthly(SP500)[,4]
DJUADJIA<-to.monthly(DJUADJIA)[,4]
#get monthly format to yyyy-mm-dd with the first day of the month
index(SP500)<-as.Date(index(SP500))
index(DJUADJIA)<-as.Date(index(DJUADJIA))
#my CRB data is end of month; could change but more fun to do in R
CRB<-to.monthly(CRB)[,4]
index(CRB)<-as.Date(index(CRB))

#let's merge all this into one xts object; CRB starts last in 1956
assets<-na.omit(merge(GS20,SP500,CRB,DJUADJIA))
#use ROC for SP500 and CRB and momentum for yield data
assetROC<-na.omit(merge(momentum(assets[,1])/100,ROC(assets[,2:4],type="discrete")))

#get Correlations
corrBondsSp<-runCor(assetROC[,1],assetROC[,2],n=7)
corrBondsCrb<-runCor(assetROC[,1],assetROC[,3],n=7)
corrSpCrb<-runCor(assetROC[,2],assetROC[,3],n=7)
#composite measure of correlations between asset classes and roc-weighted correlations
assetCorr<-(corrBondsSp+corrBondsCrb+corrSpCrb+
    (corrBondsSp*corrSpCrb*assetROC[,2])+
    (corrBondsCrb*corrSpCrb*assetROC[,3])-
    assetROC[,1])/6
#sum of ROCs of asset classes
assetROCSum<-assetROC[,1]+assetROC[,2]+assetROC[,3]
#finally the turbulence measure
turbulence<-abs(assetCorr*assetROCSum*100)
colnames(turbulence)<-"Turbulence-correlation"

chartSeries(turbulence,theme="white",name="Correlation and % Change as Measure of Financial Turbulence")
abline(h=0.8)

chart.ACF(turbulence,main="Auto-correlation of Turbulence")

#wish I could remember where I got some of this code
#most likely candidate is www.fosstrading.com
#please let me know if you know the source
#so I can give adequate credit

#use turbulence to determine in or out of equal-weighted sp500 and crb
signal<-ifelse(turbulence>0.8,0,1)
#use slope of sp500/crb to determine sp500 or crb

signal<-lag(signal,k=1)
# Replace missing signals with no position
# (generally just at beginning of series)
signal[is.na(signal)] <- 0

#get returns from equal-weighted crb and sp500 position; Return.portfolio was causing problems, so did the hard way
ret<-ifelse(signal==1,(assetROC[,2]+assetROC[,3])/2,assetROC[,4])
ret[1] <- 0

#get system performance
system_perf <- ret*signal
system_perf_util <- ret
system_eq <- cumprod(1+signal*ret)
system_eq_util <- cumprod(1+ret)

perf_comparison<-merge(lag((assetROC[,2]+assetROC[,3])/2,k=1),system_perf,system_perf_util)
colnames(perf_comparison)<-c("Equal-weighted","System-with-turbulence-filter","System-with-turbulence-filter-with-util")

charts.PerformanceSummary(perf_comparison,ylog=TRUE,main="Turbulence-based System vs Equal-Weighted CRB and SP500")

#let's use basic relative strength to pick sp500 or crb
#know I can do this better in R but here is my ugly code
#to calculate 12 month slope of sp500/crb
width=12
for (i in 1:(NROW(assets)-width)) {
    model<-lm(assets[i:(i+width),2]/assets[i:(i+width),3]~index(assets[i:(i+width)]))
    ifelse(i==1,assetSlope<-model$coefficients[2],assetSlope<-rbind(assetSlope,model$coefficients[2]))
}
assetSlope<-xts(cbind(assetSlope),order.by=index(assets)[(width+1):NROW(assets)])
#use turbulence to determine in or out of equal-weighted sp500 and crb
signal<-ifelse(turbulence>0.8,0,1)

#use slope of sp500/crb to determine sp500 or crb
signal2<-ifelse(assetSlope[,1]>0,1,2)

signal<-lag(signal,k=1)
signal[1]<-0
signal2<-lag(signal2,k=1)
signal2[1]<-0

signals_and_returns<-merge(signal,signal2,assetROC,assetSlope,turbulence)
#get sp500 or crb return based on slope when turbulence low or use bonds as cash
ret<-ifelse(signals_and_returns[,2]==1,signals_and_returns[,4],ifelse(signals_and_returns[,2]==2,signals_and_returns[,5],signals_and_returns[,3]))
#get sp500 or crb return based on slope when turbulence low or use utility spread as cash
ret_util<-ifelse(signals_and_returns[,2]==1&signals_and_returns[,1]==1,signals_and_returns[,4],
    ifelse(signals_and_returns[,2]==2&signals_and_returns[,1]==1,signals_and_returns[,5],
    signals_and_returns[,6]))
ret[1]<-0
ret_util[1]<-0

#get system performance
system_perf_rs<-signals_and_returns[,1]*ret
system_perf_rs_util<-ret_util
system_eq_rs<- cumprod(1+signals_and_returns[,1]*ret)
system_eq_rs_util<- cumprod(1+ret_util)

perf_comparison<-merge((assetROC[,2]+assetROC[,3])/2,assetROC[,2],assetROC[,3],system_perf,system_perf_util,system_perf_rs,system_perf_rs_util)
colnames(perf_comparison)<-c("Equal-weighted","S&P500","CRB","System-with-turbulence-filter","System-with-turbulence-filter-util","System-with-turbulence-filter and RS","System-with-turbulence-filter and RS-util")

charts.PerformanceSummary(perf_comparison,ylog=TRUE,main="Turbulence-based System with RS vs Equal-Weighted, CRB, and SP500")

Wednesday, May 4, 2011

R Exercise with USDA Data

After the helpful comment by Bradley on my post Commodity Index Estimators,

How about the National Agricultural Statistics Service (NASS)? Looks like they have information for prices received back to 1908 for many agricultural goods (http://www.nass.usda.gov/).

I started trying to get this USDA price data in R, but after three hours struggling to find historical data from start to finish in any useable format, had no success.  However, I did notice some gaps in my R skills, so I decided to use some USDA data for practice.  The USDA 10 year price projections for major US crops interested me.  Three more hours of struggle yielded some new R skills and the following graphs and R code.

From TimelyPortfolio

And in a slightly better cumulative return format.  Strangely, my favorite set of PerformanceAnalytics graphs returned a “format” error.

From TimelyPortfolio

Looks like the dairy business might be attractive.  Maybe, I can make money there.

One beneficial byproduct of the exercise was the discovery of http://www.farmdoc.illinois.edu/manage/uspricehistory/USPrice.asp which offers monthly crop price data in graph or table form.

Now I need to determine how to get this monthly price data from the USDA or somewhere else for R research.

Also, I thought this research piece www.farmdoc.illinois.edu/irwin/research/EmpiricalMethodsCommodity.pdf was interesting but not helpful toward this objective.

R code:

require(gdata)
require(quantmod)
require(ggplot2)

URL<-"http://usda.mannlib.cornell.edu/usda/ers/94005/2011/Table39.xls"
#get Shiller data for inflation and US Treasury 10 year
USDAprice <- read.xls(URL,sheet="Table38",pattern="2009",stringsAsFactors = FALSE)

#strip out interesting information
USDAprice<-USDAprice[3:10,]

#change row names to crop names in column 1
rownames(USDAprice)<-USDAprice[,1]

#delete column 1 since now rowname
USDAprice<-USDAprice[,2:NCOL(USDAprice)]

#insure numeric data
USDAprice<-as.data.frame(data.matrix(USDAprice))

#switch rows and columns
USDAprice<-t(USDAprice)

#get an xts version for later
USDApricexts<-USDAprice
rownames(USDApricexts)<-paste(substr(rownames(USDAprice),2,5),rep("01-01",NROW(USDAprice)),sep = "-")
USDApricexts<-as.xts(USDApricexts)

#get dates for rownames
rownames(USDAprice)<-as.Date(paste(substr(rownames(USDAprice),2,5),rep("01-01-31",NROW(USDAprice)),sep = "-"))

USDApricemelt<-melt(USDAprice)
colnames(USDApricemelt)<-c("Date","Crop","USDA_Projected_Price")
ggplot(USDApricemelt, stat="identity", aes(x=Date,y=USDA_Projected_Price,colour=Crop)) + geom_line() +
    scale_x_date(format = "%Y") +
    opts(title = "USDA Projected Crop Prices through 2020")

#standardize to get cumulative return or wealth index
USDApricereturn<-USDApricexts/lag(USDApricexts)-1
USDApricereturn[1,]<-0
USDApricereturn<-cumprod(1+USDApricereturn)

#get in format that ggplot2 can use
USDApricereturnmelt<-cbind(as.Date(index(USDApricereturn)),coredata(USDApricereturn))
rownames(USDApricereturnmelt)<-USDApricereturnmelt[,1]
USDApricereturnmelt<-USDApricereturnmelt[,(2:NCOL(USDApricereturnmelt))]
USDApricereturnmelt<-melt(USDApricereturnmelt)
colnames(USDApricereturnmelt)<-c("Date","Crop","USDA_Projected_Cumulative_Return")
ggplot(USDApricereturnmelt, stat="identity", aes(x=Date,y=USDA_Projected_Cumulative_Return,colour=Crop)) + geom_line() +
    scale_x_date(format = "%Y") +
    opts(title = "USDA Projected Crop Price Cumulative Returns through 2020")

Monday, May 2, 2011

Commodity Index Estimators

In this post I will show my first try at a commodity index substitute.  Regular readers know my frustration with proprietary data as I try to demonstrate various techniques to users who might not have the resources to pay for the data.  I have substituted US 10y Treasury Total Returns series as my bond proxy with good results, but I have so far been unable to find a free and readily available substitute for commodity indexes.
PPI is not real-time, but might offer one good 1-month lagged proxy for commodity indexes.  If we use PPI data from the St. Louis Federal Reserve FRED system, I can get close, but I am unsure if it will be close enough until further system testing.
From TimelyPortfolio
R code:
require(PerformanceAnalytics)
require(quantmod)
#getSymbols("NAPMPRI",src="FRED") #load ISM Manufacturing Price
getSymbols("PPIACO",src="FRED") #load PPI All Commodities
getSymbols("PPICRM",src="FRED") #load PPI Crude for Further Processing
getSymbols("PPIIDC",src="FRED") #load PPI Industrial
#unfortunately cannot get substitute for proprietary CRB data
#get data series from csv file
CRB<-as.xts(read.csv("spxcrbndrbond.csv",row.names=1))[,2]
#my CRB data is end of month; could change but more fun to do in R
CRB<-to.monthly(CRB)[,4]
index(CRB)<-as.Date(index(CRB))
#NAPMPRI_change<-ROC(NAPMPRI,1)
PPIACO_change<-ROC(PPIACO,1)
PPICRM_change<-ROC(PPICRM,1)
PPIIDC_change<-ROC(PPIIDC,1)
#combine all Rate of Change series with CRB lag 1 month (moved forward) to account for PPI delay
CRBandPPI<-merge(lag(CRB,k=1),PPIACO_change,PPICRM_change,PPIIDC_change)
colnames(CRBandPPI)<-c("CRB","PPI All Comm","PPI Crude for Further","PPI Industrial")
chart.CumReturns(CRBandPPI,main="CRB Estimators through PPI",legend.loc="topleft")
chart.CumReturns(CRBandPPI["1990::"],main="CRB Estimators through PPI since 1990",legend.loc="topleft")
chart.Correlation(CRBandPPI,main="CRB Estimators through PPI")
chart.Correlation(CRBandPPI["1990::"],main="CRB Estimators through PPI since 1990")

First Answer to My Own Question-Combine LSPM and Mahalanobis

I first wanted to thank http://www.fosstrading.com for the very kind and unexpected mention over the weekend.  You will notice almost all of my code contains some credit to Foss Trading for the examples and great packages.  I hate that I could not join everyone at R/Finance 2011: Applied Finance with R Conference last weekend.
In my last post Another Use of LSPM in Tactical Portfolio Allocation, I expressed a slight bit of frustration with the drawdown experienced with the final system.  Since I got no comments or feedback on improvements, I guess I will have to try to answer my own question, “How do I reduce the drawdown?”  My first thought was to use the techniques shown in my previous set of posts Great FAJ Article on Statistical Measure of Financial Turbulence Part 3 about Mahalanobis distance as a measure of financial turbulence.
faj abstract
The results demonstrate a slight improvement in max drawdown and other downside measures, but does not ultimately satisfy my constant yearning for smaller drawdown.
From TimelyPortfolio
If nothing else, maybe you can use my ggplot2 chart of a PerformanceAnalytics table.  I was pretty excited to get this working, and I plan to incorporate many more of these in my testing.
From TimelyPortfolio
I blog to record my thoughts and hopefully generate a valuable dialogue with my readers who are probably far smarter and more qualified than me.  Please comment or provide feedback.
R code:
#Please see au.tra.sy blog http://www.automated-trading-system.com/
#for original walkforward/optimize code and http://www.fosstrading.com
#for other techniques
require(PerformanceAnalytics)
require(quantmod)
require(RQuantLib)
require(reshape2)  #for some fancy ggplot charting
require(ggplot2)
#get bond returns to avoid proprietary data problems
#see previous timelyportfolio blogposts for explanation
#probably need to make this a function since I will be using so much
getSymbols("GS10",src="FRED") #load US Treasury 10y from Fed Fred
GS10pricereturn<-GS10  #set this up to hold price returns
GS10pricereturn[1,1]<-0
colnames(GS10pricereturn)<-"PriceReturn"
#I know I need to vectorize this but not qualified enough yet
#Please feel free to comment to show me how to do this
for (i in 1:(NROW(GS10)-1)) {
  GS10pricereturn[i+1,1]<-FixedRateBondPriceByYield(yield=GS10[i+1,1]/100,issueDate=Sys.Date(),
    maturityDate= advance("UnitedStates/GovernmentBond", Sys.Date(), 10, 3),
    rates=GS10[i,1]/100,period=2)[1]/100-1
}
#interest return will be yield/12 for one month
GS10interestreturn<-lag(GS10,k=1)/12/100
colnames(GS10interestreturn)<-"Interest Return"
#total return will be the price return + interest return
GS10totalreturn<-GS10pricereturn+GS10interestreturn
colnames(GS10totalreturn)<-"Bond Total Return"
#get sp500 returns from FRED
getSymbols("SP500",src="FRED") #load SP500
#unfortunately cannot get substitute for proprietary CRB data
#get data series from csv file
CRB<-as.xts(read.csv("spxcrbndrbond.csv",row.names=1))[,2]
#do a little manipulation to get the data lined up on monthly basis
GS10totalreturn<-to.monthly(GS10totalreturn)[,4]
SP500<-to.monthly(SP500)[,4]
#get monthly format to yyyy-mm-dd with the first day of the month
index(SP500)<-as.Date(index(SP500))
#my CRB data is end of month; could change but more fun to do in R
CRB<-to.monthly(CRB)[,4]
index(CRB)<-as.Date(index(CRB))
#now lets merge to get asset class returns
assetROC<-na.omit(merge(ROC(SP500,type="discrete"),CRB,GS10totalreturn))
# Set Walk-Forward parameters (number of periods)
optim<-12 #1 year = 12 monthly returns
wf<-1 #walk forward 1 monthly returns
numsys<-2
# Calculate number of WF cycles
numCycles = floor((nrow(assetROC)-optim)/wf)
# Define JPT function
# this is now part of LSPM package, but fails when no negative returns
# so I still include this where I can force a negative return
jointProbTable <- function(x, n=3, FUN=median, ...) {
  # Load LSPM
  if(!require(LSPM,quietly=TRUE)) stop(warnings())
  # handle case with no negative returns
  for (sys in 1:numsys) {
    if (min(x[,sys])> -1) x[,sys][which.min(x[,sys])]<- -0.03
  }
  # Function to bin data
  quantize <- function(x, n, FUN=median, ...) {
    if(is.character(FUN)) FUN <- get(FUN)
    bins <- cut(x, n, labels=FALSE)
    res <- sapply(1:NROW(x), function(i) FUN(x[bins==bins[i]], ...))
  }
  # Allow for different values of 'n' for each system in 'x'
  if(NROW(n)==1) {
    n <- rep(n,NCOL(x))
  } else
  if(NROW(n)!=NCOL(x)) stop("invalid 'n'")
  # Bin data in 'x'
  qd <- sapply(1:NCOL(x), function(i) quantize(x[,i],n=n[i],FUN=FUN,...))
  # Aggregate probabilities
  probs <- rep(1/NROW(x),NROW(x))
  res <- aggregate(probs, by=lapply(1:NCOL(qd), function(i) qd[,i]), sum)
  # Clean up output, return lsp object
  colnames(res) <- colnames(x)
  res <- lsp(res[,1:NCOL(x)],res[,NCOL(res)])
  return(res)
}
for (i in 0:(numCycles-1)) {
            # Define cycle boundaries
            start<-1+(i*wf)
            end<-optim+(i*wf)
            # Get returns for optimization cycle and create the JPT
        # specify number of bins; does not seem to drastically affect results
        numbins<-6
            jpt <- jointProbTable(assetROC[start:end,1:numsys],n=rep(numbins,numsys))
            outcomes<-jpt[[1]]
            probs<-jpt[[2]]
            port<-lsp(outcomes,probs)
            # DEoptim parameters (see ?DEoptim)
            np=numsys*10       # 10 * number of mktsys
            imax=1000       #maximum number of iterations
            crossover=0.6       #probability of crossover
            NR <- NROW(port$f)
            DEctrl <- list(NP=np, itermax=imax, CR=crossover, trace=TRUE)
            # Optimize f
            res <- optimalf(port, control=DEctrl)
        # use upper to restrict to a level that you might feel comfortable
            #res <- optimalf(port, control=DEctrl, lower=rep(0,13), upper=rep(0.2,13))
    # these are other possibilities but I gave up after 24 hours
        #maxProbProfit from Foss Trading
        #res<-maxProbProfit(port, 1e-6, 6, probDrawdown, 0.1, DD=0.2, control=DEctrl)
        #probDrawdown from Foss Trading
        #res<-optimalf(port,probDrawdown,0.1,DD=0.2,horizon=6,control=DEctrl)
            # Save leverage amounts as optimal f
        # Examples in the book Ralph Vince Leverage Space Trading Model
        # all in dollar terms which confuses me
        # until I resolve I changed lev line to show optimal f output
        lev<-res$f[1:numsys]
            #lev<-c(res$f[1]/(-jpt$maxLoss[1]/10),res$f[2]/(-jpt$maxLoss[2]/10))
            levmat<-c(rep(1,wf)) %o% lev #so that we can multiply with the wfassetROC
            # Get the returns for the next Walk-Forward period
            wfassetROC <- assetROC[(end+1):(end+wf),1:numsys]
            wflevassetROC <- wfassetROC*levmat #apply leverage to the returns
            if (i==0) fullassetROC<-wflevassetROC else fullassetROC<-rbind(fullassetROC,wflevassetROC)
        if (i==0) levered<-levmat else levered<-rbind(levered,levmat)
}
#not super familiar with xts, but this add dates to levered
levered<-xts(levered,order.by=index(fullassetROC) )
colnames(levered)<-c("sp500 optimal f","crb optimal f")
chart.TimeSeries(levered, legend.loc="topleft", cex.legend=0.6)
#review the optimal f values
#I had to fill the window to my screen to avoid a error from R on margins
par(mfrow=c(numsys,1))
for (i in 1:numsys) {
    chart.TimeSeries(levered[,i],xlab=NULL)
}
#charts.PerformanceSummary(fullassetROC, ylog=TRUE, main="Performance Summary with Optimal f Applied as Allocation")
assetROCAnalyze<-merge(assetROC,fullassetROC)
colnames(assetROCAnalyze)<-c("sp500","crb","US10y","sp500 f","crb f")
charts.PerformanceSummary(assetROCAnalyze,ylog=TRUE,main="Performance Summary with Optimal f Applied as Allocation")
#build a portfolio with sp500 and crb
leveredadjust<-levered
#allow up to 50% allocation in CRB
leveredadjust[,2]<-ifelse(levered[,2]<0.25,0,0.5)
#allow up to 100% allocation in SP500 but portfolio constrained to 1 leverage
leveredadjust[,1]<-ifelse(levered[,1]<0.25,0,1-levered[,2])
colnames(leveredadjust)<-c("sp500 portfolio allocation","crb portfolio allocation")
assetROCadjust<-merge(assetROCAnalyze,leveredadjust[,1:2]*assetROC[,1:2])
colnames(assetROCadjust)<-c("sp500","crb","US10y","sp500 f","crb f","sp500 system component","crb system component")
charts.PerformanceSummary(assetROCadjust,ylog=TRUE)
#review the allocations versus optimal f
#I had to fill the window to my screen to avoid a error from R on margins
par(mfrow=c(numsys,1))
for (i in 1:numsys) {
    chart.TimeSeries(merge(levered[,i],leveredadjust[,i]),xlab=NULL,legend.loc="topleft",main="")
}
#add bonds when out of sp500 or crb
assetROCportfolio<-assetROCadjust[,6]+assetROCadjust[,7]+ifelse(leveredadjust[,1]+leveredadjust[,2] >= 1,0,(1-leveredadjust[,1]-leveredadjust[,2])*assetROC[,3])
assetROCadjust<-merge(assetROCAnalyze,assetROCportfolio)
colnames(assetROCadjust)<-c("sp500","crb","US10y","sp500 f","crb f","system portfolio")
charts.PerformanceSummary(assetROCadjust[,c(1:3,6)],ylog=TRUE,main="Optimal f System Portfolio with Bond Filler")
#see timelyportfolio blog post http://timelyportfolio.blogspot.com/2011/04/great-faj-article-on-statistical_6197.html
#get Correlations for Mahalanobis filter
#get data from St. Louis Federal Reserve (FRED) to add 20y USTreasury data
getSymbols("GS20",src="FRED") #load 20yTreasury; 20y has gap 86-93; 30y has gap in early 2000s
getSymbols("GS30",src="FRED") #load 30yTreasury to fill 20y gap 86-93
#fill 20y gap from discontinued 20y Treasuries with 30y
GS20["1987-01::1993-09"]<-GS30["1987-01::1993-09"]
assetROC<-merge(assetROC,momentum(GS20)/100)
corrBondsSp<-runCor(assetROC[,4],assetROC[,1],n=7)
corrBondsCrb<-runCor(assetROC[,4],assetROC[,2],n=7)
corrSpCrb<-runCor(assetROC[,2],assetROC[,1],n=7)
#composite measure of correlations between asset classes and roc-weighted correlations
assetCorr<-(corrBondsSp+corrBondsCrb+corrSpCrb+
    (corrBondsSp*corrSpCrb*assetROC[,1])+
    (corrBondsCrb*corrSpCrb*assetROC[,2])-
    assetROC[,4])/6
#sum of ROCs of asset classes
assetROCSum<-assetROC[,1]+assetROC[,2]+assetROC[,4]
#finally the turbulence measure
turbulence<-abs(assetCorr*assetROCSum*100)
colnames(turbulence)<-"Turbulence-correlation"
signal<-ifelse(turbulence>0.8,0,1)
signal<-lag(signal,k=1)
signal[0]<-0
system_perf_turbulence<-assetROCportfolio*signal
perf_compare<-merge(assetROC[,1:2],assetROCportfolio,system_perf_turbulence)
colnames(perf_compare)<-c("SP500","CRB","LSPMportfolio","LSPMportfolio_turbulence")
charts.PerformanceSummary(perf_compare,ylog=TRUE,colorset=c("gray70","goldenrod","cadetblue","darkolivegreen3"),main="Comparison of Original LSPM System and Turbulence LSPM System")
downsideTable<-melt(cbind(rownames(table.DownsideRisk(perf_compare)),table.DownsideRisk(perf_compare)))
colnames(downsideTable)<-c("Statistic","Portfolio","Value")
ggplot(downsideTable, stat="identity", aes(x=Statistic,y=Value,fill=Portfolio)) + geom_bar(position="dodge") + coord_flip()

Friday, April 29, 2011

Another Use of LSPM in Tactical Portfolio Allocation

After the slightly unconventional use of LSPM presented in Slightly Different Use of Ralph Vince’s Leverage Space Trading Model, I thought I should follow up with something that more closely resembles my interpretation of Ralph Vince’s book.

LSPM seems to work well for portfolio allocation problems.  In this tactical allocation system, I will use optimal f derived in R with the LSPM package to build a portfolio with SP500, US10y, and the CRB.  If we use the optimal f as our allocation to SP500 and CRB, then the results look like this.

From TimelyPortfolio

In general, my biggest problem is applying my systems to an entire portfolio.  The components are easy, but the blending is troublesome.  If I apply a basic method of monthly rebalancing of the SP500 and CRB, I get something like this (not using any leverage).

From TimelyPortfolio

SP500 component improves, but because of my 50% limit on the more mean reverting CRB, the CRB component underperforms the straight optimal f allocation.

From TimelyPortfolio

Since most clients don’t like cash, we can fill the portfolio with bonds when there is room left over after the CRB and SP500 allocation.  The total package look like this.

From TimelyPortfolio

As always, I would like my posts to stimulate discussion and thought.  The drawdown here is much more severe than I would like.  Please let me know how you would improve this system.

R code:

#Please see au.tra.sy blog http://www.automated-trading-system.com/
#for original walkforward/optimize code and http://www.fosstrading.com
#for other techniques

require(PerformanceAnalytics)
require(quantmod)
require(RQuantLib)

#get bond returns to avoid proprietary data problems
#see previous timelyportfolio blogposts for explanation
#probably need to make this a function since I will be using so much
getSymbols("GS10",src="FRED") #load US Treasury 10y from Fed Fred

GS10pricereturn<-GS10  #set this up to hold price returns

GS10pricereturn[1,1]<-0
colnames(GS10pricereturn)<-"PriceReturn"
#I know I need to vectorize this but not qualified enough yet
#Please feel free to comment to show me how to do this
for (i in 1:(NROW(GS10)-1)) {
  GS10pricereturn[i+1,1]<-FixedRateBondPriceByYield(yield=GS10[i+1,1]/100,issueDate=Sys.Date(),
    maturityDate= advance("UnitedStates/GovernmentBond", Sys.Date(), 10, 3),
    rates=GS10[i,1]/100,period=2)[1]/100-1
}

#interest return will be yield/12 for one month
GS10interestreturn<-lag(GS10,k=1)/12/100
colnames(GS10interestreturn)<-"Interest Return"

#total return will be the price return + interest return
GS10totalreturn<-GS10pricereturn+GS10interestreturn
colnames(GS10totalreturn)<-"Bond Total Return"

#get sp500 returns from FRED
getSymbols("SP500",src="FRED") #load SP500

#unfortunately cannot get substitute for proprietary CRB data
#get data series from csv file
CRB<-as.xts(read.csv("spxcrbndrbond.csv",row.names=1))[,2]

#do a little manipulation to get the data lined up on monthly basis
GS10totalreturn<-to.monthly(GS10totalreturn)[,4]
SP500<-to.monthly(SP500)[,4]
#get monthly format to yyyy-mm-dd with the first day of the month
index(SP500)<-as.Date(index(SP500))
#my CRB data is end of month; could change but more fun to do in R
CRB<-to.monthly(CRB)[,4]
index(CRB)<-as.Date(index(CRB))

#now lets merge to get asset class returns
assetROC<-na.omit(merge(ROC(SP500,type="discrete"),CRB,GS10totalreturn))

# Set Walk-Forward parameters (number of periods)
optim<-12 #1 year = 12 monthly returns
wf<-1 #walk forward 1 monthly returns

numsys<-2
# Calculate number of WF cycles
numCycles = floor((nrow(assetROC)-optim)/wf)
# Define JPT function
# this is now part of LSPM package, but fails when no negative returns
# so I still include this where I can force a negative return
jointProbTable <- function(x, n=3, FUN=median, ...) {
  # Load LSPM
  if(!require(LSPM,quietly=TRUE)) stop(warnings())

  # handle case with no negative returns
  for (sys in 1:numsys) {
    if (min(x[,sys])> -1) x[,sys][which.min(x[,sys])]<- -0.03
  }
  # Function to bin data
  quantize <- function(x, n, FUN=median, ...) {
    if(is.character(FUN)) FUN <- get(FUN)
    bins <- cut(x, n, labels=FALSE)
    res <- sapply(1:NROW(x), function(i) FUN(x[bins==bins[i]], ...))
  }
  # Allow for different values of 'n' for each system in 'x'
  if(NROW(n)==1) {
    n <- rep(n,NCOL(x))
  } else
  if(NROW(n)!=NCOL(x)) stop("invalid 'n'")
  # Bin data in 'x'
  qd <- sapply(1:NCOL(x), function(i) quantize(x[,i],n=n[i],FUN=FUN,...))
  # Aggregate probabilities
  probs <- rep(1/NROW(x),NROW(x))
  res <- aggregate(probs, by=lapply(1:NCOL(qd), function(i) qd[,i]), sum)
  # Clean up output, return lsp object
  colnames(res) <- colnames(x)
  res <- lsp(res[,1:NCOL(x)],res[,NCOL(res)])
  return(res)
}

for (i in 0:(numCycles-1)) {
            # Define cycle boundaries
            start<-1+(i*wf)
            end<-optim+(i*wf)
            # Get returns for optimization cycle and create the JPT
        # specify number of bins; does not seem to drastically affect results
        numbins<-6
            jpt <- jointProbTable(assetROC[start:end,1:numsys],n=rep(numbins,numsys))
            outcomes<-jpt[[1]]
            probs<-jpt[[2]]
            port<-lsp(outcomes,probs)
            # DEoptim parameters (see ?DEoptim)
            np=numsys*10       # 10 * number of mktsys
            imax=1000       #maximum number of iterations
            crossover=0.6       #probability of crossover
            NR <- NROW(port$f)
            DEctrl <- list(NP=np, itermax=imax, CR=crossover, trace=TRUE)
            # Optimize f
            res <- optimalf(port, control=DEctrl)
        # use upper to restrict to a level that you might feel comfortable
            #res <- optimalf(port, control=DEctrl, lower=rep(0,13), upper=rep(0.2,13))

    # these are other possibilities but I gave up after 24 hours
        #maxProbProfit from Foss Trading
        #res<-maxProbProfit(port, 1e-6, 6, probDrawdown, 0.1, DD=0.2, control=DEctrl)
        #probDrawdown from Foss Trading
        #res<-optimalf(port,probDrawdown,0.1,DD=0.2,horizon=6,control=DEctrl)

            # Save leverage amounts as optimal f
        # Examples in the book Ralph Vince Leverage Space Trading Model
        # all in dollar terms which confuses me
        # until I resolve I changed lev line to show optimal f output
        lev<-res$f[1:numsys]
            #lev<-c(res$f[1]/(-jpt$maxLoss[1]/10),res$f[2]/(-jpt$maxLoss[2]/10))
            levmat<-c(rep(1,wf)) %o% lev #so that we can multiply with the wfassetROC
            # Get the returns for the next Walk-Forward period
            wfassetROC <- assetROC[(end+1):(end+wf),1:numsys]
            wflevassetROC <- wfassetROC*levmat #apply leverage to the returns
            if (i==0) fullassetROC<-wflevassetROC else fullassetROC<-rbind(fullassetROC,wflevassetROC)
        if (i==0) levered<-levmat else levered<-rbind(levered,levmat)
}

#not super familiar with xts, but this add dates to levered
levered<-xts(levered,order.by=index(fullassetROC) )
colnames(levered)<-c("sp500 optimal f","crb optimal f")
chart.TimeSeries(levered, legend.loc="topleft", cex.legend=0.6)

#review the optimal f values
#I had to fill the window to my screen to avoid a error from R on margins
par(mfrow=c(numsys,1))
for (i in 1:numsys) {
    chart.TimeSeries(levered[,i],xlab=NULL)
}

#charts.PerformanceSummary(fullassetROC, ylog=TRUE, main="Performance Summary with Optimal f Applied as Allocation")

assetROCAnalyze<-merge(assetROC,fullassetROC)
colnames(assetROCAnalyze)<-c("sp500","crb","US10y","sp500 f","crb f")
charts.PerformanceSummary(assetROCAnalyze,ylog=TRUE,main="Performance Summary with Optimal f Applied as Allocation")

#build a portfolio with sp500 and crb
leveredadjust<-levered
#allow up to 50% allocation in CRB
leveredadjust[,2]<-ifelse(levered[,2]<0.25,0,0.5)
#allow up to 100% allocation in SP500 but portfolio constrained to 1 leverage
leveredadjust[,1]<-ifelse(levered[,1]<0.25,0,1-levered[,2])
colnames(leveredadjust)<-c("sp500 portfolio allocation","crb portfolio allocation")
assetROCadjust<-merge(assetROCAnalyze,leveredadjust[,1:2]*assetROC[,1:2])
colnames(assetROCadjust)<-c("sp500","crb","US10y","sp500 f","crb f","sp500 system component","crb system component")
charts.PerformanceSummary(assetROCadjust,ylog=TRUE)

#review the allocations versus optimal f
#I had to fill the window to my screen to avoid a error from R on margins
par(mfrow=c(numsys,1))
for (i in 1:numsys) {
    chart.TimeSeries(merge(levered[,i],leveredadjust[,i]),xlab=NULL,legend.loc="topleft",main="")
}

#add bonds when out of sp500 or crb
assetROCportfolio<-assetROCadjust[,6]+assetROCadjust[,7]+ifelse(leveredadjust[,1]+leveredadjust[,2] >= 1,0,(1-leveredadjust[,1]-leveredadjust[,2])*assetROC[,3])
assetROCadjust<-merge(assetROCAnalyze,assetROCportfolio)
colnames(assetROCadjust)<-c("sp500","crb","US10y","sp500 f","crb f","system portfolio")
charts.PerformanceSummary(assetROCadjust[,c(1:3,6)],ylog=TRUE,main="Optimal f System Portfolio with Bond Filler")

Tuesday, April 26, 2011

Great FAJ Article on Statistical Measure of Financial Turbulence Part 3

Building on posts Great FAJ Article on Statistical Measure of Financial Turbulence and Great FAJ Article on Statistical Measure of Financial Turbulence Part 2, I will now build a system incorporating a new correlation-based measure of turbulence and a simple relative strength technique.  First, the new correlation-based measure looks like this

From TimelyPortfolio

Then if we build a system with just this new correlation-based turbulence, we get fairly good results.  However, if we take one step extra and apply a slope-based relative strength to choose S&P500 or CRB rather than equal-weight both, we get even better results.

From TimelyPortfolio

I always want more data in countries and years, but 1957 is pretty thorough.  Please let me know how you would improve this system.


R code:

require(quantmod)
require(PerformanceAnalytics)

#get data from St. Louis Federal Reserve (FRED)
getSymbols("GS20",src="FRED") #load 20yTreasury; 20y has gap 86-93; 30y has gap in early 2000s
getSymbols("GS30",src="FRED") #load 30yTreasury to fill 20y gap 86-93
getSymbols("BAA",src="FRED") #load BAA
getSymbols("SP500",src="FRED") #load SP500

#get CRB data from a csv file
CRB<-as.xts(read.csv("crb.csv",row.names=1))[,1]

#fill 20y gap from discontinued 20y Treasuries with 30y
GS20["1987-01::1993-09"]<-GS30["1987-01::1993-09"]

#do a little manipulation to get the data lined up on monthly basis
SP500<-to.monthly(SP500)[,4]
#get monthly format to yyyy-mm-dd with the first day of the month
index(SP500)<-as.Date(index(SP500))
#my CRB data is end of month; could change but more fun to do in R
CRB<-to.monthly(CRB)[,4]
index(CRB)<-as.Date(index(CRB))

#let's merge all this into one xts object; CRB starts last in 1956
assets<-na.omit(merge(GS20,SP500,CRB))
#use ROC for SP500 and CRB and momentum for yield data
assetROC<-na.omit(merge(momentum(assets[,1])/100,ROC(assets[,2:3],type="discrete")))

#get Correlations
corrBondsSp<-runCor(assetROC[,1],assetROC[,2],n=7)
corrBondsCrb<-runCor(assetROC[,1],assetROC[,3],n=7)
corrSpCrb<-runCor(assetROC[,2],assetROC[,3],n=7)
#composite measure of correlations between asset classes and roc-weighted correlations
assetCorr<-(corrBondsSp+corrBondsCrb+corrSpCrb+
    (corrBondsSp*corrSpCrb*assetROC[,2])+
    (corrBondsCrb*corrSpCrb*assetROC[,3])-
    assetROC[,1])/6
#sum of ROCs of asset classes
assetROCSum<-assetROC[,1]+assetROC[,2]+assetROC[,3]
#finally the turbulence measure
turbulence<-abs(assetCorr*assetROCSum*100)
colnames(turbulence)<-"Turbulence-correlation"

chartSeries(turbulence,theme="white",name="Correlation and % Change as Measure of Financial Turbulence")
abline(h=0.8)

chart.ACF(turbulence,main="Auto-correlation of Turbulence")

#wish I could remember where I got some of this code
#most likely candidate is www.fosstrading.com
#please let me know if you know the source
#so I can give adequate credit

#use turbulence to determine in or out of equal-weighted sp500 and crb
signal<-ifelse(turbulence>0.8,0,1)
#use slope of sp500/crb to determine sp500 or crb

signal<-lag(signal,k=1)
# Replace missing signals with no position
# (generally just at beginning of series)
signal[is.na(signal)] <- 0

#get returns from equal-weighted crb and sp500 position; Return.portfolio was causing problems, so did the hard way
ret<-(assetROC[,2]+assetROC[,3])/2
ret[1] <- 0

#get system performance
system_perf<-ret*signal
system_eq<- cumprod(1+ret*signal)

perf_comparison<-merge(lag((assetROC[,2]+assetROC[,3])/2,k=1),system_perf)
colnames(perf_comparison)<-c("Equal-weighted","System-with-turbulence-filter")

charts.PerformanceSummary(perf_comparison,ylog=TRUE,main="Turbulence-based System vs Equal-Weighted CRB and SP500")

#let's use basic relative strength to pick sp500 or crb
#know I can do this better in R but here is my ugly code
#to calculate 12 month slope of sp500/crb
width=12
for (i in 1:(NROW(assets)-width)) {
    model<-lm(assets[i:(i+width),2]/assets[i:(i+width),3]~index(assets[i:(i+width)]))
    ifelse(i==1,assetSlope<-model$coefficients[2],assetSlope<-rbind(assetSlope,model$coefficients[2]))
}
assetSlope<-xts(cbind(assetSlope),order.by=index(assets)[(width+1):NROW(assets)])
#use turbulence to determine in or out of equal-weighted sp500 and crb
signal<-ifelse(turbulence[(width):NROW(turbulence)]>0.8,0,1)

#use slope of sp500/crb to determine sp500 or crb
signal2<-ifelse(assetSlope>0,1,2)

signal<-lag(signal,k=1)
signal[1]<-0
signal2<-lag(signal2,k=1)
signal2[1]<-0

#get sp500 or crb return based on slope
ret<-ifelse(signal2==1,assetROC[(width):NROW(assetROC),2],ifelse(signal2==2,assetROC[(width):NROW(assetROC),3],0))

#get system performance
system_perf_rs<-ret*signal
system_eq_rs<- cumprod(1+ret*signal)

perf_comparison<-merge((assetROC[,2]+assetROC[,3])/2,assetROC[,2],assetROC[,3],system_perf,system_perf_rs)
colnames(perf_comparison)<-c("Equal-weighted","S&P500","CRB","System-with-turbulence-filter","System-with-turbulence-filter and RS")

charts.PerformanceSummary(perf_comparison,ylog=TRUE,main="Turbulence-based System with RS vs Equal-Weighted, CRB, and SP500")