US investors were spoiled by US Treasuries which acted as a near perfect hedge to stocks during the 2008-2009 crisis. However, in real crisis, bonds rarely offer any comfort, and asset allocation fails (see post Death Spiral of a Country and IMF paper Systemic Banking Crises Database: An Update; by Luc Laeven ... – IMF). As a very timely example, we can examine Spain, which is not even to crisis level yet.
![]() |
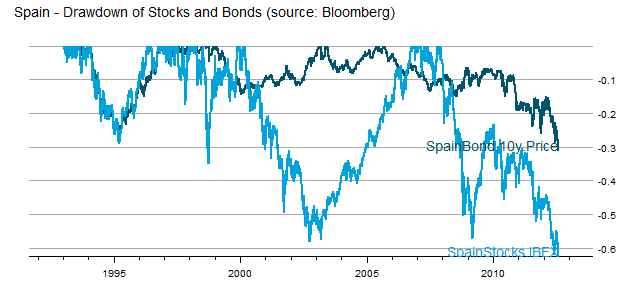
From TimelyPortfolio |
In Spain, there is nowhere to hide, and allocation offers no comfort.
R code in Gist (click raw to copy/paste):
This file contains bidirectional Unicode text that may be interpreted or compiled differently than what appears below. To review, open the file in an editor that reveals hidden Unicode characters.
Learn more about bidirectional Unicode characters
#analyze asset allocation experience in Spain | |
require(lattice) | |
require(latticeExtra) | |
require(reshape2) | |
require(directlabels) | |
require(quantmod) | |
require(PerformanceAnalytics) | |
require(RQuantLib) | |
data <- read.csv("spain stocks and bond from bloomberg.csv",stringsAsFactors=FALSE) | |
spainstock <- na.omit(as.xts(as.numeric(data[2:NROW(data),2]),order.by=as.Date(data[2:NROW(data),1],"%m/%d/%Y"))) | |
colnames(spainstock) <- "SpainStocks.IBEX" | |
spainbond <- na.omit(as.xts(as.numeric(data[2:NROW(data),5]),order.by=as.Date(data[2:NROW(data),4],"%m/%d/%Y"))) | |
colnames(spainbond) <- "SpainBonds.10y" | |
spainbondpricereturn<-spainbond | |
spainbondpricereturn[1,1]<-0 | |
colnames(spainbondpricereturn)<-"SpainBond.10y.Price" | |
#use quantlib to price the Spanish bonds from yields | |
#these are 10 year bonds so will advance date by 10 years | |
#we can just use US/GovtBond calendar | |
for (i in 1:(NROW(spainbond)-1)) { | |
spainbondpricereturn[i+1,1]<-FixedRateBondPriceByYield(yield=spainbond[i+1,1]/100,issueDate=Sys.Date(), | |
maturityDate= advance("UnitedStates/GovernmentBond", Sys.Date(), 10, 3), | |
rates=spainbond[i,1]/100,period=2)[1]/100-1 | |
} | |
#merge returns | |
spain.return <- na.omit(merge(spainbondpricereturn,ROC(spainstock,type="discrete",n=1))) | |
#get drawdowns | |
spain.drawdown <- Drawdowns(spain.return) | |
#get in melted data.frame for lattice | |
spain.drawdown.df <- as.data.frame(cbind(index(spain.drawdown),coredata(spain.drawdown))) | |
spain.drawdown.melt <- melt(spain.drawdown.df,id.vars=1) | |
colnames(spain.drawdown.melt) <- c("date","series","drawdown") | |
spain.drawdown.melt[,"date"] <- as.Date(spain.drawdown.melt[,"date"]) | |
#plot drawdowns | |
direct.label(asTheEconomist( | |
xyplot(drawdown~date,groups=series,data=spain.drawdown.melt, | |
main="Spain - Drawdown of Stocks and Bonds (source: Bloomberg)")), | |
list("last.points",hjust=1,vjust=0,cex=1.2)) |
Surely you could build a system based on the principle of "nowhere to hide" like
ReplyDeleteIF gold(LOCALCURRENCY) < 10MA THEN
switch 60% to bonds
switch 40% to stocks
IF stocks/LOCALCURRENCY < 10MA THEN
switch 60% to X
IF bonds < 10MA THEN
switch 40% to X
WHERE
IF gold(LOCALCURRENCY) < 10MA
X IS 3-month LOCALCURRENCY
IF gold(LOCALCURRENCY > 10MA
X IS gold
Wow that came out a lot more jumbled up than I intended, hope you get the idea.
ReplyDelete