Wednesday, June 4, 2014

Active Share and Tracking Error | Not Mutually Exclusive Decisions

Antti Petajisto got a lot of attention with his research on Active Share and Tracking Error in mutual fund management.  While the research is fairly compelling, there is a missing discussion about a potential relationship between the two measures. The paper seems to suggest that mutual fund managers can independently and intentionally pursue Active Share and/or Tracking Error.  However, some research from the PIMCO Quantitative Team argues that Active Share and Tracking Error are related and that they can easily be a byproduct of other decisions such as benchmark or fund exposure.  I strongly suggest reading both sets of research to gather a full understanding of these concepts.

Table 2 is simple enough, but despite its simplicity I could not visualize in my head, so I copied the data and with a couple lines of R + rCharts got all the visualization I needed.

image


replicate:

source code from Github

Thursday, May 15, 2014

PDF Chart–> Inkscape SVG –> d3 Interactive Chart

I just spent the last couple of days updating myself on the newest research on currency management.  For the best real-time (delayed about a year) broad look, BIS puts out an incredibly helpful Triennial Central Bank Survey of foreign exchange... in which you see things like this

image

and this.

image

pdfs suffer from a lack of interactivity, so I thought why not use Inkscape’s PDF to SVG conversion to strip the above chart and make it SVG.  Then, if everything goes well, experiment with some basic interactivity provided by d3.js.  Here is what happened.

If anyone would like a more extensive write up of the process, please let me know.

Tuesday, May 6, 2014

High Frequency | Winners and Losers by Chord

I admit it looks like I am the only person in the world who has not read Michael Lewis’  Flash Boys.

I was more attracted to this fine paper with slightly fewer views than Flash Boys.

Baron, Matthew and Brogaard, Jonathan and Kirilenko, Andrei A.,
Risk and Return in High Frequency Trading
May 5, 2014
Available at SSRN: http://ssrn.com/abstract=2433118

The paper offers an incredible view of the players and their effects in the E-mini S&P 500 futures contract.   The data was so good that I just had to unlock the data from their tables.  By far my favorite table was table 7 with “the decomposition of average daily short-term profits among different trader types in August 2010.”  The profits are given as average daily $ profit and profit per trade per contract.  The d3 chord layout seemed perfect to visualize this data.  Fortunately, Ben Hunter had just blogged about his custom rCharts implementation of the chord layout in Chord Diagram with rCharts.  In beautiful open source fashion, I was able to adapt it and quickly view the data as below.  I am not sure how exactly it ties to Flash Boys, but I am guessing that this lends some credibilty to the story.  Just look at the miserable losses of “Small Traders”.

As a comparison between interactive and static graphs, I’ll add some ggplot2 versions.  I will admit that I spent little time customizing any of the charts above or below.  I will save that for later.

image

image

Source at Github: https://github.com/timelyportfolio/rCharts_chord

Tuesday, April 29, 2014

Slidify Old Book Images from Google Books

I really enjoy reading old books, especially finance books, from Google Books.  With all the changes in the world, their continued relevance amazes me.  For instance, as I prepared for my talk about Wealth and Skill, I rediscovered Developing Financial Skill by Enoch Gowin (1922).  I had forgotten some of the interesting visualizations in the book, and I just had to publicize them.  With some R and slidify, I made a IO2012 slideshow of the images in less than an hour.  Each of the images are linked to their original location in the book if you want the context.  Below are a quote from the book along with an image linking to the slideshow.

It appears in the well-thought-out conclusions of Justice Holmes, Doctor Beecher, President Hadley, Professors Fisher, Moore, and Cohn, Lord Kelvin, and Jesse Livermore that current views concerning speculation have confused it with gambling. Its real nature, however, set forth here, provides food for profitable reflection. Speculators, in reality, whether or not they think of themselves as being such, are all men who look ahead, the risk takers, men prudent, farsighted, "longheaded," forward-looking—to whom business profits sooner or later cannot fail to gravitate.

image

Wednesday, April 23, 2014

All the Factors | More Looks

Well, my last post Exploring Factors with rCharts and factorAnalytics got enough attention to motivate me to pull in some more Asness, Frazzini, Pedersen factors and plot them in some different ways.  The additional factors are US and global UMD (up minus down) and QMJ (quality minus junk) introduced in this paper.

Quality Minus Junk

Asness, Clifford S. and Frazzini, Andrea and Pedersen, Lasse Heje

October 9, 2013

Available at SSRN: http://ssrn.com/abstract=2312432

I used rCharts and dimplejs to draw a cumulative line chart.

Then I thought this would be a great opportunity to use the correlation chart spawned by rCharts issue 381.


Of course the next step is to simply merge the BAB (Betting Against  Beta) factors from the previous post, but I’ll leave that to you.  Let me know what you discover.

Monday, April 21, 2014

Exploring Factors with rCharts and factorAnalytics

Fama and French changed the financial world with their factors in 1993.  Another duo Andrea Frazzini and Lasse Heje Pedersen have expanded our world with their Betting Against Beta (BAB) and Quality Minus Junk (QMJ)  factors.  The combined factor set of Fama/French and Frazzini/Pedersen provides substantial insight into the historical performance of equities in the US and around the world.

Fortunately for us, the authors have also made available their factors.  Unfortunately, BAB and QMJ are not updated like the Fama/French SMB and HML. (actually discovered this is no longer true Frazzini data library)  Still though, combining these factors with the R packages factorAnalytics and rCharts allows us to do some amazing things.  Here is a quick example. Look for more soon.

Tuesday, April 15, 2014

Wealth and Skill | A Talk to Students

I enjoyed talking to University of Alabama students this morning about wealth, skill, and luck.  I tried to synthesize a whole lot of research into something meaningful.  Of course, it would not have been possible without rCharts + Slidify.  Thanks Ramnath. Thanks to my good friend Dr. Underwood for the invitation. Click here or on the screenshot below for the show.

image

Friday, April 11, 2014

Find it Humorous … “Not So Bad” in the “long-term”

I agree the market selloff has been weak thus far (especially as a frustrated bear).  However, I find it humorous as some widely followed commentators say things like “You’re only down x% ytd.  It’s not that bad”.  I wonder if this selloff gets worse will they extend to a 12 month horizon since last year was so good.  Immediately makes me think of 1987.

  October 19, 1987 : Today was not so bad.  You are only down 3% ytd.

image

Edit:  Ok, I just had to add an interactive version:


Friday, April 4, 2014

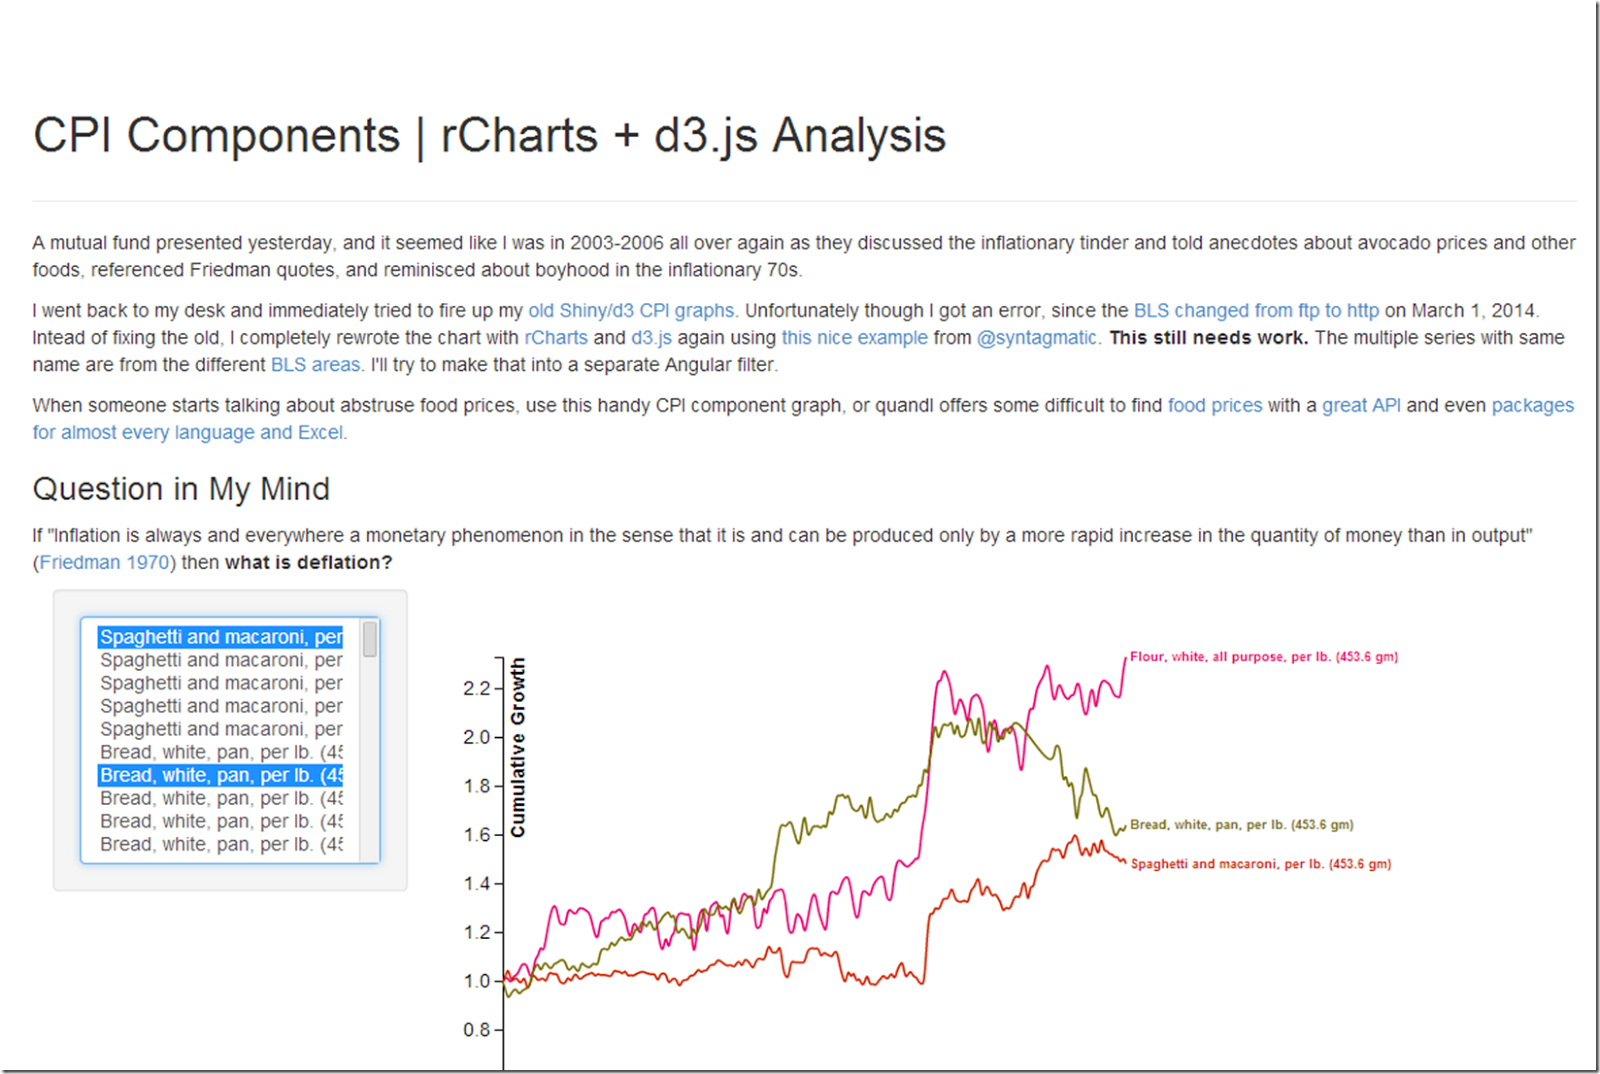
R as a Publishing Engine | CPI Components Use Case

R was certainly not designed to be a publishing engine, but in my workflow, R is the primary method of content creation.  With that in mind, I have been thinking about a very different use case of rCharts in which we might want to include inflexible and not really reusable custom javascript components in our document.  As a quick example after updating my CPI component graph using d3.js and angular, I want to plug it into a document and really only need to modify a couple of parameters.  While someone might want to use this for different data, I doubt it.

rCharts seamless integration with knitr/slidify/Rpres makes this very easy.  I just wonder how popular this will become.

image

Wednesday, April 2, 2014

xts like endpoints in Javascript

I decided to promote this from a Twitter comment to a blog post.  I had hoped to do a prototype javascript interactive rebalancing visualization of Unsolved Mysteries of Rebalancing integrating this, but I have not had the time, so  I’ll release it into the wild in its current state.  I hope someone can use it.

image