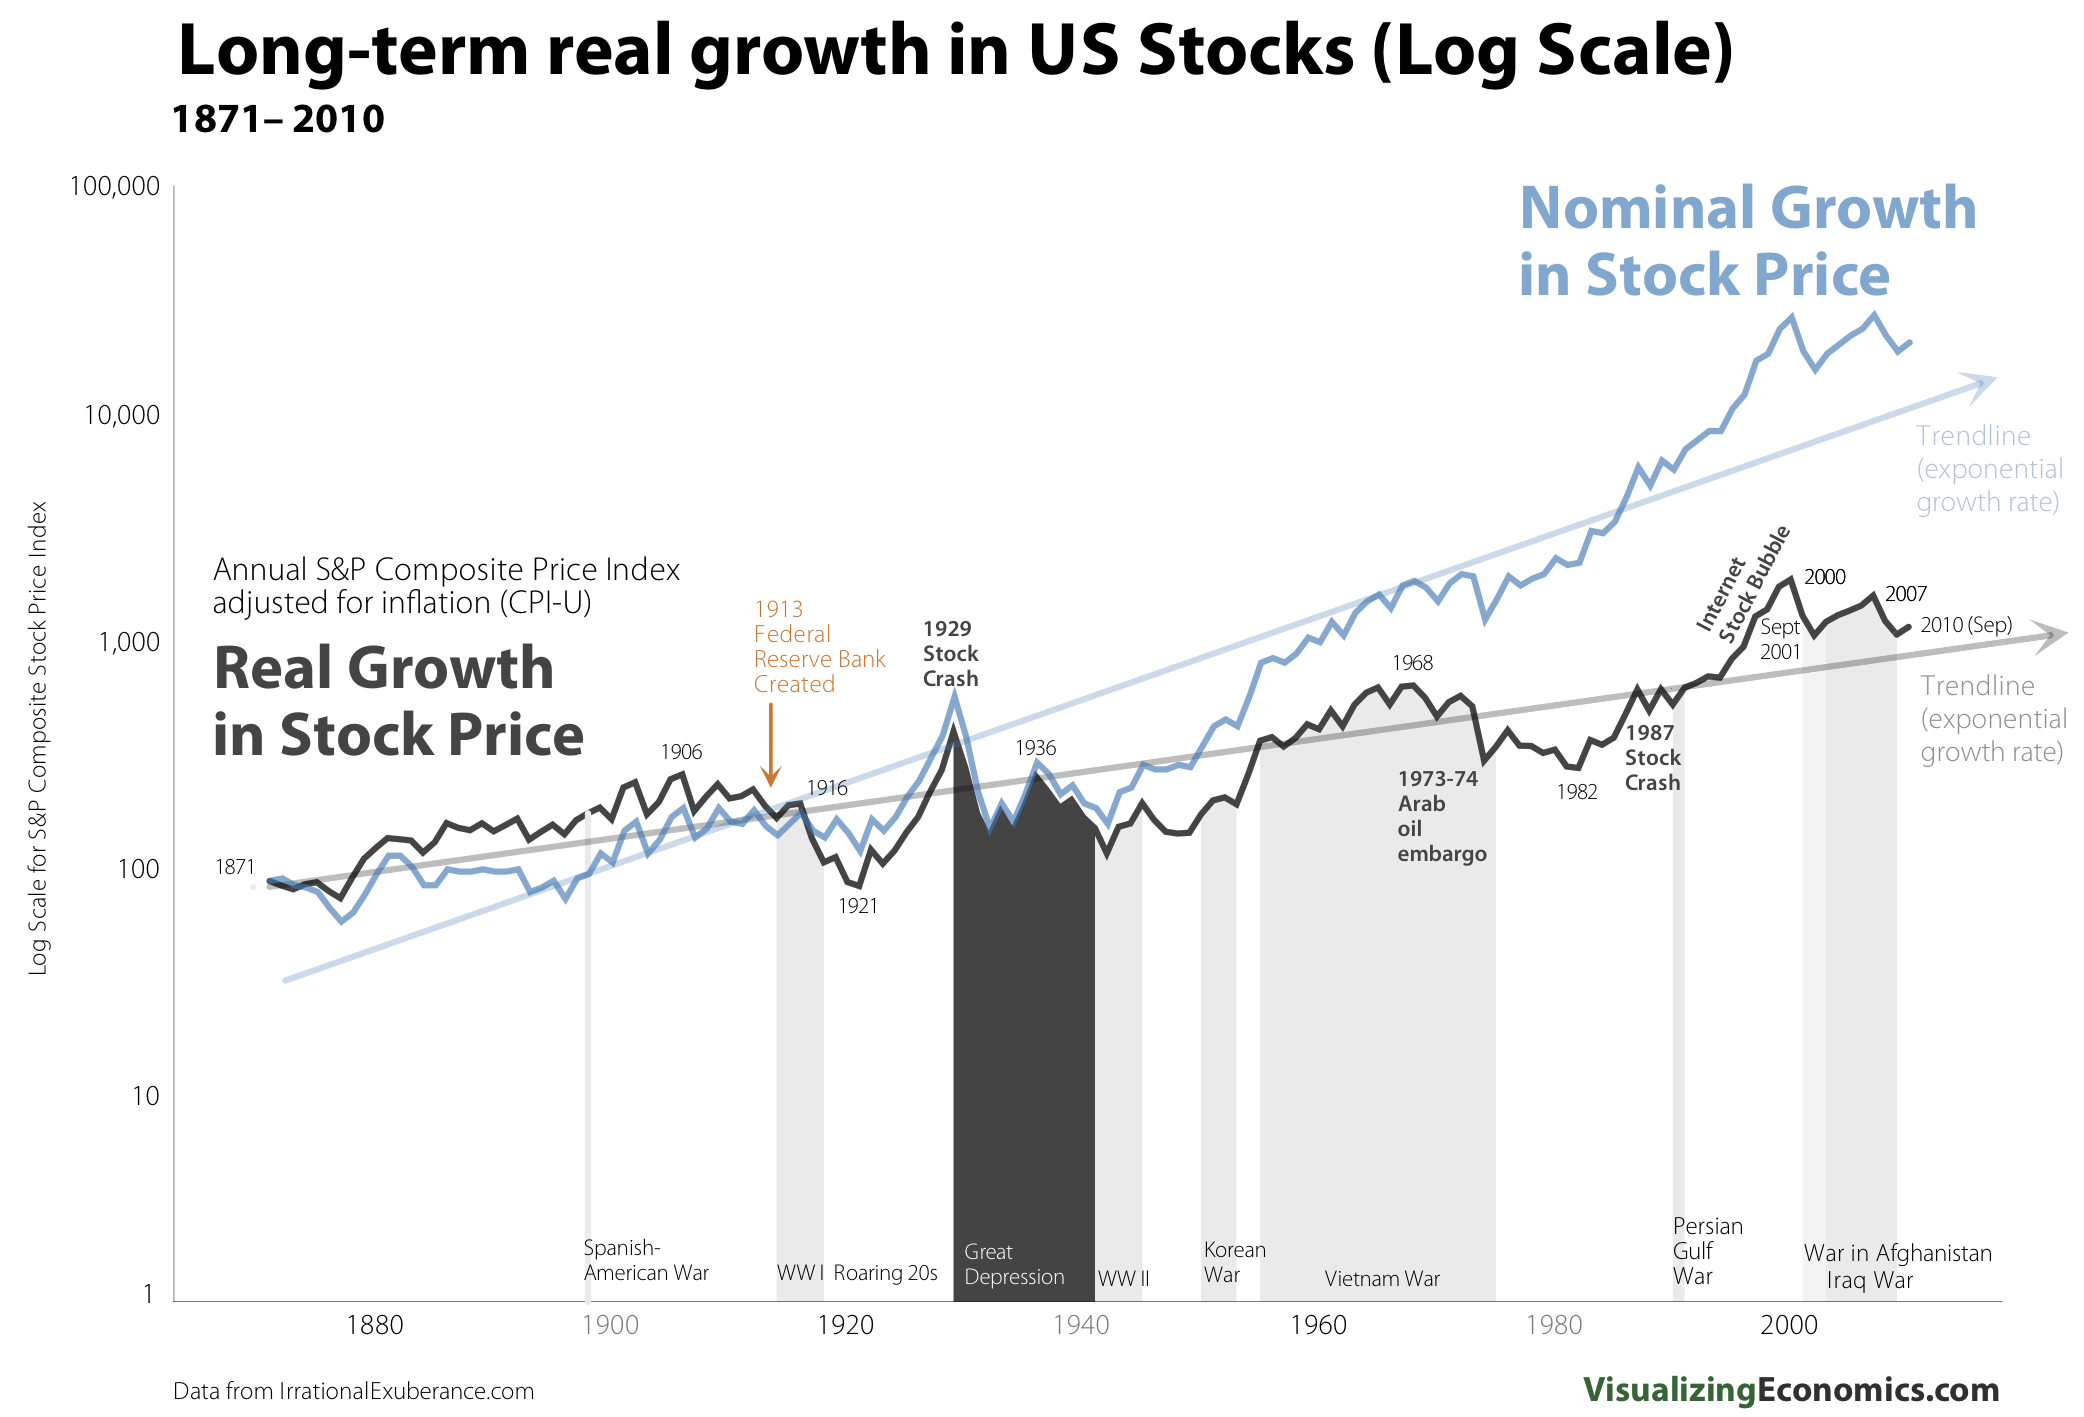
I characterize a “bubble” as irrational overvaluation based on the belief that potential returns are infinite and pursued by uncharacteristic amounts of money. Based on this definition, bonds cannot ever be a bubble because potential returns and overvaluation are mathematically constrained by the zero bound of interest rates. However, after a 30 year run, bonds are a constrained bubble. I have seen stocks graphed based on long term linear forecasts (most recently and beautifully in Visualizing Economics), but very rarely see a similar chart for bonds, so using the same Shiller dataset, I have plotted bonds with some interesting overlays.
That is a lot of lines, so let’s narrow it down to the experience since 1980 but keeping the long-term framework in mind.
or maybe we can look at bonds one more way in terms of price return on a 5 year rolling basis. 1980-2010 certainly stands out.
2 hours


No comments:
Post a Comment